Drawing rectangles with a custom indicator on the indicator_separate_window
Mistake #1: You create an indicator handle but don't check the result. An example of how to work with the indicator: An example of working with iCustom - we get the indicator data in the EA [data folder]\MQL5\Indicators\Examples\MACD.mq5
Mistake #2: You are copying data from buffer '0'
Mistake #3: The cycle is wrong:the buffer number for iMACD is equal to 0 - MAIN_LINE, 1 - SIGNAL_LINE - this is clear and right. That is, you should not use '0', but ' MAIN_LINE'
for ( int i=copy; i>= 0 ;i--)
need a cycle
   int limit=prev_calculated-1;
   if(prev_calculated==0)
   limit=0;
   for(int i=limit;i<rates_total;i++)
     {

     }
Mistake #4: You are creating a rectangle in subwindow '1' - this is not correct. Subwindow '1' may have the wrong indicator, or ...

- www.mql5.com
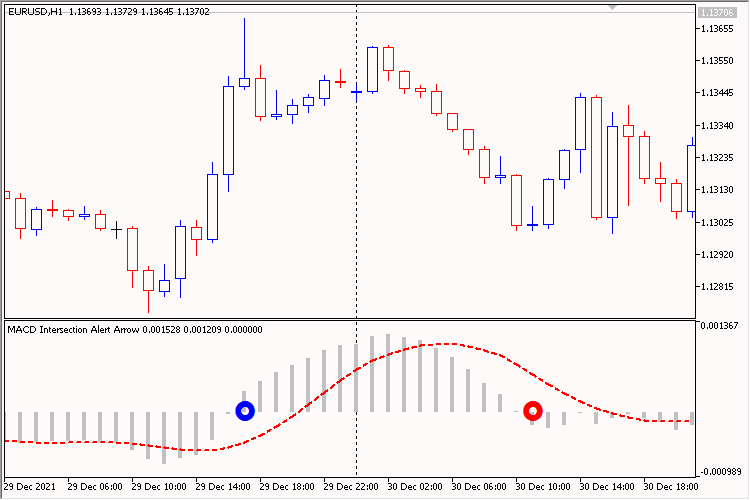
Tip: It's better to use the DRAW_COLOR_ARROW drawing style instead of rectangles. Example:
Code:
//+------------------------------------------------------------------+
//|                                      MACD Intersection Arrow.mq5 |
//|                              Copyright © 2022, Vladimir Karputov |
//|                      https://www.mql5.com/en/users/barabashkakvn |
//+------------------------------------------------------------------+
#property copyright "Copyright © 2022, Vladimir Karputov"
#property link      "https://www.mql5.com/en/users/barabashkakvn"
#property version   "1.000"
#property indicator_separate_window
#property indicator_buffers 4
#property indicator_plots   3
//--- plot MACD_Last_Сrossing
#property indicator_label1  "MACD"
#property indicator_type1   DRAW_HISTOGRAM
#property indicator_color1  clrSilver
#property indicator_style1  STYLE_SOLID
#property indicator_width1  2
#property indicator_label2  "Signal"
#property indicator_type2   DRAW_LINE
#property indicator_color2  clrRed
#property indicator_style2  STYLE_DASH
#property indicator_width2  2
//--- plot Intersection
#property indicator_label3  "Intersection"
#property indicator_type3   DRAW_COLOR_ARROW
#property indicator_color3  clrBlue,clrRed
#property indicator_style3  STYLE_SOLID
#property indicator_width3  3
//--- input parameters
input group             "MACD"
input int                  Inp_MACD_fast_ema_period= 12;             // MACD: period for Fast average calculation
input int                  Inp_MACD_slow_ema_period= 26;             // MACD: period for Slow average calculation
input int                  Inp_MACD_signal_period  = 9;              // MACD: period for their difference averaging
input ENUM_APPLIED_PRICE   Inp_MACD_applied_price  = PRICE_CLOSE;    // MACD: type of price
input group             "Arrow"
input uchar                InpUpCode               = 163;            // Arrow Up: code (font Wingdings)
//--- indicator buffers
double   MACDBuffer[];
double   SignalBuffer[];
double   ArrowBuffer[];
double   ColorColors[];
//---
int      handle_iMACD;                       // variable for storing the handle of the iMACD indicator
int      bars_calculated         = 0;        // we will keep the number of values in the Moving Averages Convergence/Divergence indicator
int      start                   = 0;
bool     m_init_error      = false;    // error on InInit
//+------------------------------------------------------------------+
//| Custom indicator initialization function                         |
//+------------------------------------------------------------------+
int OnInit()
  {
//--- indicator buffers mapping
   SetIndexBuffer(0,MACDBuffer,INDICATOR_DATA);
   SetIndexBuffer(1,SignalBuffer,INDICATOR_DATA);
   SetIndexBuffer(2,ArrowBuffer,INDICATOR_DATA);
   SetIndexBuffer(3,ColorColors,INDICATOR_COLOR_INDEX);
//--- setting a code from the Wingdings charset as the property of PLOT_ARROW
   PlotIndexSetInteger(2,PLOT_ARROW,InpUpCode);
//--- set the vertical shift of arrows in pixels
   PlotIndexSetInteger(2,PLOT_ARROW_SHIFT,0);
//--- an empty value for plotting, for which there is no drawing
   PlotIndexSetDouble(2,PLOT_EMPTY_VALUE,EMPTY_VALUE);
//--- create handle of the indicator iMACD
   handle_iMACD=iMACD(Symbol(),Period(),Inp_MACD_fast_ema_period,Inp_MACD_slow_ema_period,
                      Inp_MACD_signal_period,Inp_MACD_applied_price);
//--- if the handle is not created
   if(handle_iMACD==INVALID_HANDLE)
     {
      //--- tell about the failure and output the error code
      PrintFormat("Failed to create handle of the iMACD indicator for the symbol %s/%s, error code %d",
                  Symbol(),
                  EnumToString(Period()),
                  GetLastError());
      //--- the indicator is stopped early
      m_init_error=true;
      return(INIT_SUCCEEDED);
     }
   start=Inp_MACD_fast_ema_period+Inp_MACD_slow_ema_period+Inp_MACD_signal_period;
//---
   return(INIT_SUCCEEDED);
  }
//+------------------------------------------------------------------+
//| Custom indicator iteration function                              |
//+------------------------------------------------------------------+
int OnCalculate(const int rates_total,
                const int prev_calculated,
                const datetime &time[],
                const double &open[],
                const double &high[],
                const double &low[],
                const double &close[],
                const long &tick_volume[],
                const long &volume[],
                const int &spread[])
  {
   if(rates_total<start || m_init_error)
      return(0);
//--- number of values copied from the iMACD indicator
   int values_to_copy;
//--- determine the number of values calculated in the indicator
   int calculated=BarsCalculated(handle_iMACD);
   if(calculated<=0)
     {
      PrintFormat("BarsCalculated() returned %d, error code %d",calculated,GetLastError());
      return(0);
     }
//--- if it is the first start of calculation of the indicator or if the number of values in the iMACD indicator changed
//---or if it is necessary to calculated the indicator for two or more bars (it means something has changed in the price history)
   if(prev_calculated==0 || calculated!=bars_calculated || rates_total>prev_calculated+1)
     {
      //--- if the MACDBuffer array is greater than the number of values in the iMACD indicator for symbol/period, then we don't copy everything
      //--- otherwise, we copy less than the size of indicator buffers
      if(calculated>rates_total)
         values_to_copy=rates_total;
      else
         values_to_copy=calculated;
     }
   else
     {
      //--- it means that it's not the first time of the indicator calculation, and since the last call of OnCalculate()
      //--- for calculation not more than one bar is added
      values_to_copy=(rates_total-prev_calculated)+1;
     }
//--- fill the arrays with values of the iMACD indicator
//--- if FillArraysFromBuffer returns false, it means the information is nor ready yet, quit operation
   if(!FillArraysFromBuffers(MACDBuffer,SignalBuffer,handle_iMACD,values_to_copy))
      return(0);
//--- memorize the number of values in the Moving Averages indicator Convergence/Divergence
   bars_calculated=calculated;
//--- main loop
   int limit=rates_total-values_to_copy;
   if(limit<=0)
     {
      ArrowBuffer[0]=EMPTY_VALUE;
      ColorColors[0]=0.0;
      limit=1;
     }
   for(int i=limit; i<rates_total; i++)
     {
      ArrowBuffer[i]=EMPTY_VALUE;
      if(MACDBuffer[i-1]<0.0 && MACDBuffer[i]>0.0)
        {
         ArrowBuffer[i]=0.0;
         ColorColors[i]=0.0;
         continue;
        }
      if(MACDBuffer[i-1]>0.0 && MACDBuffer[i]<0.0)
        {
         ArrowBuffer[i]=0.0;
         ColorColors[i]=1.0;
         continue;
        }
     }
//--- return value of prev_calculated for next call
   return(rates_total);
  }
//+------------------------------------------------------------------+
//| Indicator deinitialization function                              |
//+------------------------------------------------------------------+
void OnDeinit(const int reason)
  {
//---
  }
//+------------------------------------------------------------------+
//| Filling indicator buffers from the iMACD indicator               |
//+------------------------------------------------------------------+
bool FillArraysFromBuffers(double &macd_buffer[],    // indicator buffer of MACD values
                           double &signal_buffer[],  // indicator buffer of the signal line of MACD
                           int ind_handle,           // handle of the iMACD indicator
                           int amount                // number of copied values
                          )
  {
//--- reset error code
   ResetLastError();
//--- fill a part of the iMACDBuffer array with values from the indicator buffer that has 0 index
   if(CopyBuffer(ind_handle,0,0,amount,macd_buffer)<0)
     {
      //--- if the copying fails, tell the error code
      PrintFormat("Failed to copy data from the iMACD indicator, error code %d",GetLastError());
      //--- quit with zero result - it means that the indicator is considered as not calculated
      return(false);
     }
//--- fill a part of the SignalBuffer array with values from the indicator buffer that has index 1
   if(CopyBuffer(ind_handle,1,0,amount,signal_buffer)<0)
     {
      //--- if the copying fails, tell the error code
      PrintFormat("Failed to copy data from the iMACD indicator, error code %d",GetLastError());
      //--- quit with zero result - it means that the indicator is considered as not calculated
      return(false);
     }
//--- everything is fine
   return(true);
  }
//+------------------------------------------------------------------+

- www.mql5.com
- Vladimir Karputov #:Tip: It's better to use the DRAW_COLOR_ARROW drawing style instead of rectangles. Example:
I agree
- tlcunha:
RectangleCreate(0, "rect_" + IntegerToString(i), 1, time[i], 20, time[i]+10
If you insist on a rectangle, you can't use an as-series index in object names, as they are not unique. As soon as a new bar starts, you will be trying to create a new name (e.g. "name0"), same, existing, previous, name (e.g. “name0” now on bar one.)
Use time (as int) or a non-series index:
#define SERIES(I) (Bars - 1 - I) // As-series to non-series or back.
Mistake #1: You create an indicator handle but don't check the result. An example of how to work with the indicator: An example of working with iCustom - we get the indicator data in the EA [data folder]\MQL5\Indicators\Examples\MACD.mq5
Mistake #2: You are copying data from buffer '0'
Mistake #3: The cycle is wrong:the buffer number for iMACD is equal to 0 - MAIN_LINE, 1 - SIGNAL_LINE - this is clear and right. That is, you should not use '0', but ' MAIN_LINE'
need a cycle
Mistake #4: You are creating a rectangle in subwindow '1' - this is not correct. Subwindow '1' may have the wrong indicator, or ...
Hi Vladimir,
Thanks for the quick response.
About mistake #2, I was copying the wrong buffer, I must have changed it at some point. But it should not matter as far as drawing the rectangles.
About mistake #1 I fixed it. I added a check for the handle to make sure it is valid. But the handle was ok and it changed nothing.
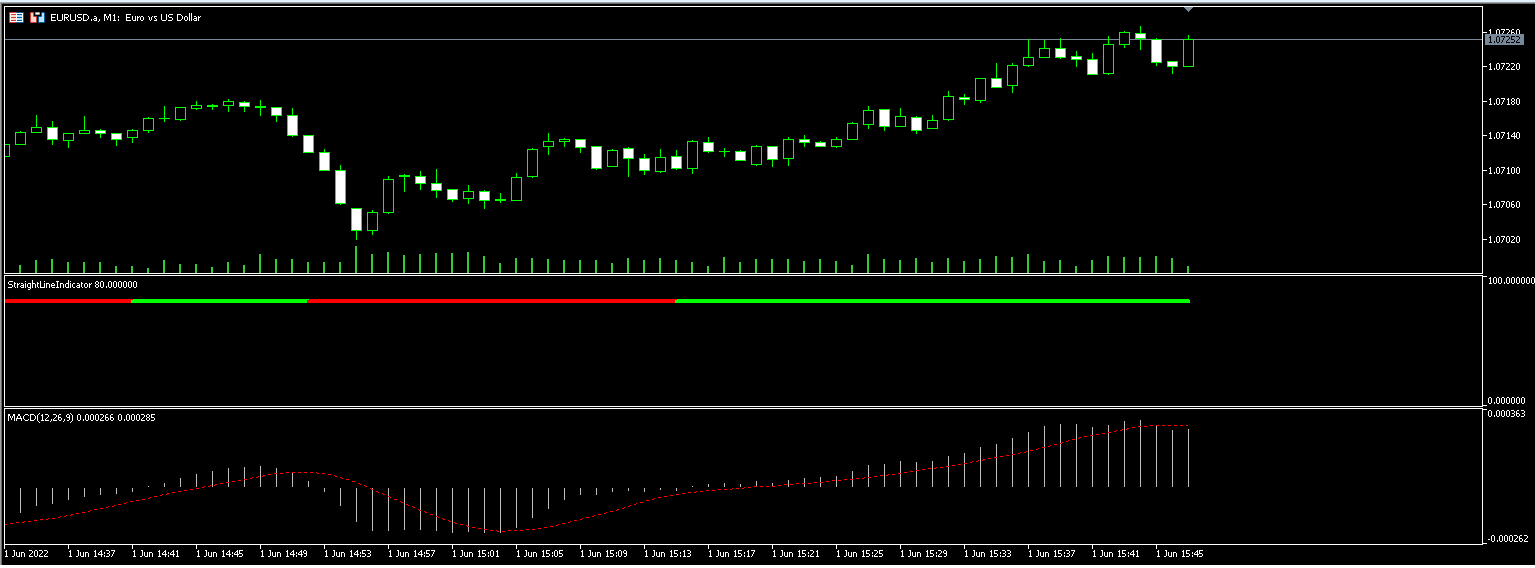
About mistake #3 It is not wrong. I changed the indicator code to draw a line and it worked just fine. I just cant get to display the squares like my requirement. I paste the code and screen shot.
About mistake #4 I have no idea what your meant and I guess thats the whole problem I am trying to solve it.
//+------------------------------------------------------------------+
//|                                        StraightLineIndicator.mq5 |
//|                                  Copyright 2022, MetaQuotes Ltd. |
//|                                             https://www.mql5.com |
//+------------------------------------------------------------------+
#property copyright "Copyright 2022, MetaQuotes Ltd."
#property link      "https://www.mql5.com"
#property version   "1.00"
#property indicator_separate_window
#property indicator_minimum 0
#property indicator_maximum 100
#property indicator_buffers 3
#property indicator_plots   1
//--- plot Label1
#property indicator_label1  "Label1"
#property indicator_type1   DRAW_COLOR_LINE
#property indicator_color1  clrRed,clrLime
#property indicator_style1  STYLE_SOLID
#property indicator_width1  5

#define RED 0
#define LIME 1
//--- indicator buffers
double         Label1Buffer[];
double         Label1Colors[];
double         MacdHistBuffer[];

int macdHandle;
//+------------------------------------------------------------------+
//| Custom indicator initialization function                         |
//+------------------------------------------------------------------+
int OnInit()
  {
//--- indicator buffers mapping
   SetIndexBuffer(0,Label1Buffer,INDICATOR_DATA);
   SetIndexBuffer(1,Label1Colors,INDICATOR_COLOR_INDEX);
   SetIndexBuffer(2, MacdHistBuffer, INDICATOR_CALCULATIONS);

   ArraySetAsSeries(Label1Buffer, true);
   ArraySetAsSeries(Label1Colors, true);
   ArraySetAsSeries(MacdHistBuffer, true);

   macdHandle = iMACD(_Symbol, _Period, 12, 26, 9, PRICE_CLOSE);

   if(macdHandle == INVALID_HANDLE)
    return INIT_FAILED;

//---
   return(INIT_SUCCEEDED);
  }
//+------------------------------------------------------------------+
//| Create rectangle by the given coordinates                        |
//+------------------------------------------------------------------+
bool RectangleCreate(const long            chart_ID=0,        // chart's ID
                     const string          name="Rectangle",  // rectangle name
                     const int             sub_window=0,      // subwindow index
                     datetime              time1=0,           // first point time
                     double                price1=0,          // first point price
                     datetime              time2=0,           // second point time
                     double                price2=0,          // second point price
                     const color           clr=clrRed,        // rectangle color
                     const ENUM_LINE_STYLE style=STYLE_SOLID, // style of rectangle lines
                     const int             width=1,           // width of rectangle lines
                     const bool            fill=false,        // filling rectangle with color
                     const bool            back=false,        // in the background
                     const bool            selection=true,    // highlight to move
                     const bool            hidden=true,       // hidden in the object list
                     const long            z_order=0)         // priority for mouse click
  {
//--- set anchor points' coordinates if they are not set
   //ChangeRectangleEmptyPoints(time1,price1,time2,price2);
//--- reset the error value
   ResetLastError();

//--- create a rectangle by the given coordinates
   if(!ObjectCreate(chart_ID,name,OBJ_RECTANGLE,sub_window,time1,price1,time2,price2))
     {
      Print(__FUNCTION__,
            ": failed to create a rectangle! Error code = ",GetLastError());
      return(false);
     }
//--- set rectangle color
   ObjectSetInteger(chart_ID,name,OBJPROP_COLOR,clr);
//--- set the style of rectangle lines
   ObjectSetInteger(chart_ID,name,OBJPROP_STYLE,style);
//--- set width of the rectangle lines
   ObjectSetInteger(chart_ID,name,OBJPROP_WIDTH,width);
//--- enable (true) or disable (false) the mode of filling the rectangle
   ObjectSetInteger(chart_ID,name,OBJPROP_FILL,fill);
//--- display in the foreground (false) or background (true)
   ObjectSetInteger(chart_ID,name,OBJPROP_BACK,back);
//--- enable (true) or disable (false) the mode of highlighting the rectangle for moving
//--- when creating a graphical object using ObjectCreate function, the object cannot be
//--- highlighted and moved by default. Inside this method, selection parameter
//--- is true by default making it possible to highlight and move the object
   ObjectSetInteger(chart_ID,name,OBJPROP_SELECTABLE,selection);
   ObjectSetInteger(chart_ID,name,OBJPROP_SELECTED,selection);
//--- hide (true) or display (false) graphical object name in the object list
   ObjectSetInteger(chart_ID,name,OBJPROP_HIDDEN,hidden);
//--- set the priority for receiving the event of a mouse click in the chart
   ObjectSetInteger(chart_ID,name,OBJPROP_ZORDER,z_order);
//--- successful execution
   return(true);
  }
//+------------------------------------------------------------------+
//| Custom indicator iteration function                              |
//+------------------------------------------------------------------+
int OnCalculate(const int rates_total,
                const int prev_calculated,
                const datetime &time[],
                const double &open[],
                const double &high[],
                const double &low[],
                const double &close[],
                const long &tick_volume[],
                const long &volume[],
                const int &spread[])
  {
//---
   ArraySetAsSeries(time, true);
   ArraySetAsSeries(open, true);
   int copy = MathMin(rates_total - prev_calculated, rates_total - 1);

   if(CopyBuffer(macdHandle, 0, 0, copy+1, MacdHistBuffer)<0) return 0;

   for(int i=copy; i>=0;i--)
   {
      Label1Buffer[i] = 80;
      Label1Colors[i] = MacdHistBuffer[i] >= 0 ? LIME : RED;

      //color rectColor = MacdHistBuffer[i] >= 0 ? clrLime : clrRed;
      //if(RectLabelCreate(0, "rect_" + IntegerToString(i), 1, x-5, 20, 10, 10, rectColor, BORDER_FLAT, CORNER_LEFT_UPPER, rectColor, STYLE_SOLID, 2, false, false, true, 0))

      //RectangleCreate(0, "rect_" + IntegerToString(i), 1, time[i], 20, time[i]+10, 30, rectColor, STYLE_SOLID, 2, true, false, false, true, 0);
   }
//--- return value of prev_calculated for next call
   return(rates_total);
  }
//+------------------------------------------------------------------+
Tip: It's better to use the DRAW_COLOR_ARROW drawing style instead of rectangles. Example:
Code:
Tip: It's better to use the DRAW_COLOR_ARROW drawing style instead of rectangles. Example:
Code:
Thanks Vladimir,
One of my requirements is to draw squares, so I cant use the DRAW_COLOR_ARROW unless that is my last resort.
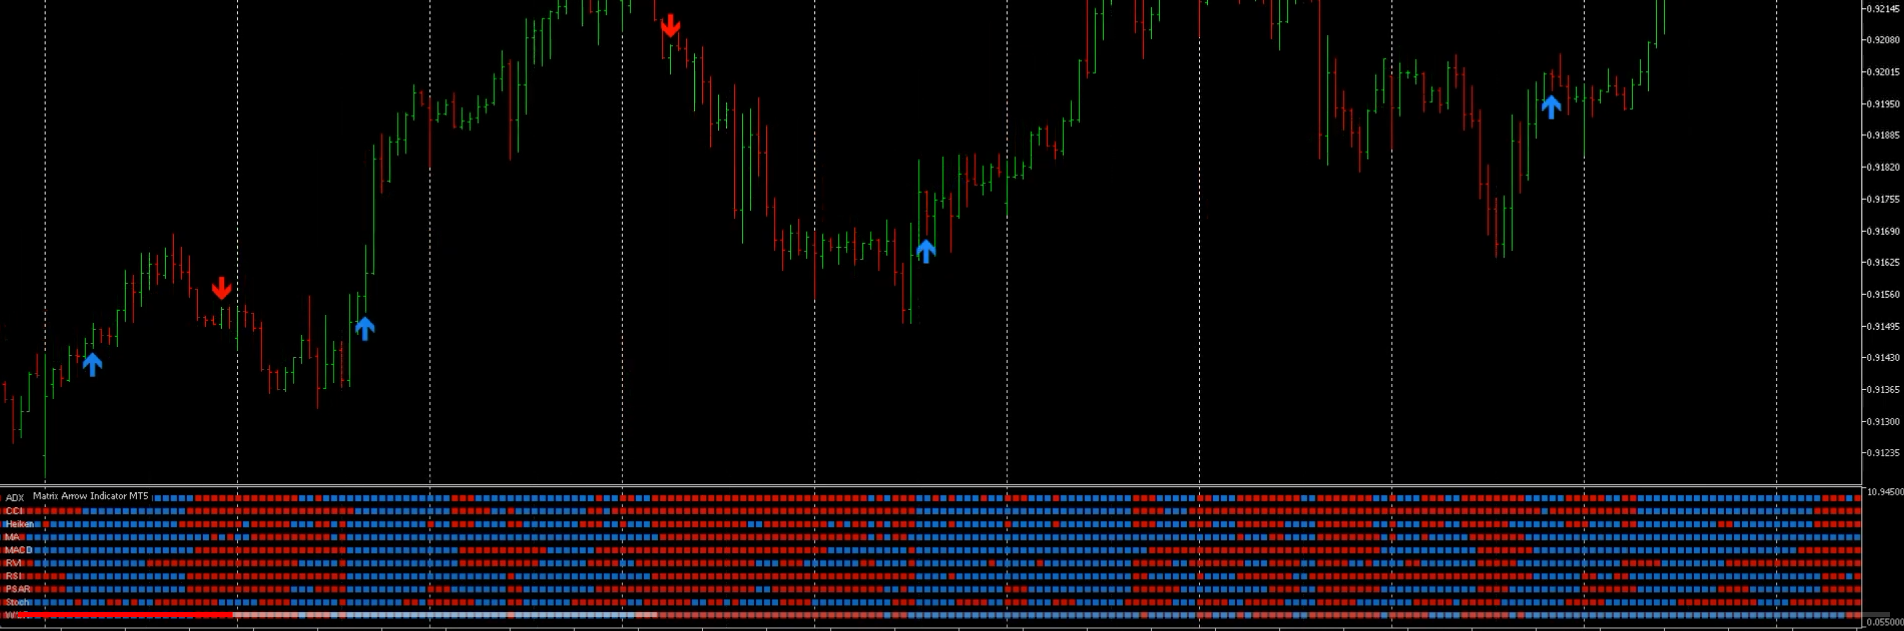
I will attach a sample image of the squares I am trying to get.
Thank you
-
I agree
-
If you insist on a rectangle, you can't use an as-series index in object names, as they are not unique. As soon as a new bar starts, you will be trying to create a new name (e.g. "name0"), same, existing, previous, name (e.g. “name0” now on bar one.)
Use time (as int) or a non-series index:
Thanks Wiliam,
1. Like I answered Vladimir. I need the squares, unless there is no way to do it. But I did attach an image with the squares on an indicator I found online.
2. You are right. The names will repeat them at some point. But I cannot even get to show any of the drawn squares. I have no Ideia why? do You know why? Can you provide a snippet of a working code?
Thank you for your response
Thanks Vladimir,
One of my requirements is to draw squares, so I cant use the DRAW_COLOR_ARROW unless that is my last resort.
I will attach a sample image of the squares I am trying to get.
Thank you
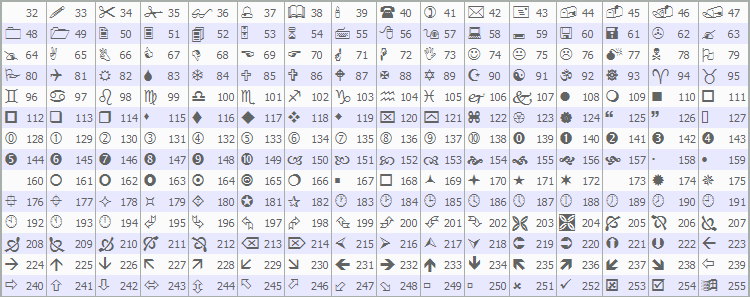
Graphic objects in such a huge amount - it's very bad and stupid. Explore the ' Wingdings ' font:

- www.mql5.com
- Free trading apps
- Over 8,000 signals for copying
- Economic news for exploring financial markets
You agree to website policy and terms of use
Am I thinking about this the wrong way? I have seen indicator like this before. Can anyone help me? Here is the code of what I have so far.