Help me to Understand the Candlestick Chart
Hi guys.. I’m finding it difficult to understand the Charts. I can’t read it to be honest. I need help.. anyone please.
Files:
C03D9F5E-CA0D-4D14-A29F-CADA8E4B1542.png
325 kb
yomore:
Hi guys.. I’m finding it difficult to understand the Charts. I can’t read it to be honest. I need help.. anyone please.
Hi guys.. I’m finding it difficult to understand the Charts. I can’t read it to be honest. I need help.. anyone please.
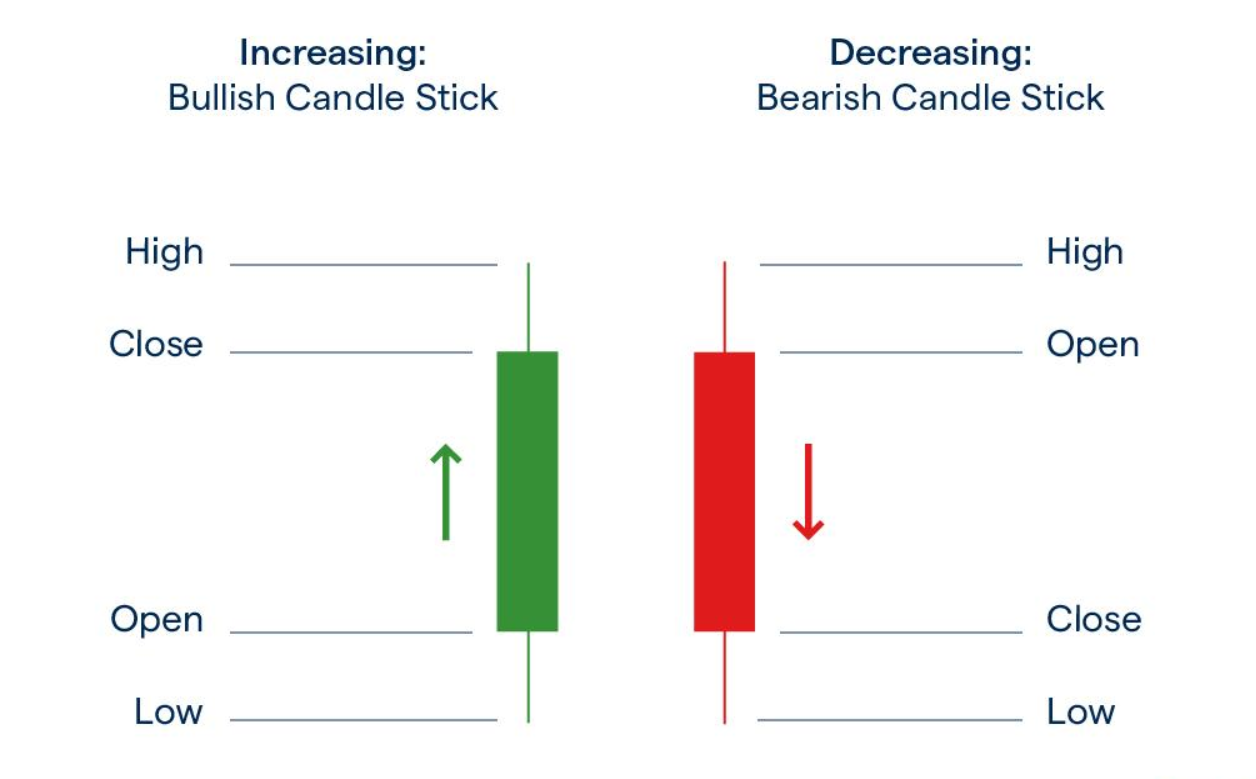
Try right click on your chart >> Properties (at the bottom) >> Colors >> Bar Down >> Red.
Now you have Bar Down >> Green/Lime and its confusing.
Candlestick was used to track rice price in 18th century.
You are missing trading opportunities:
- Free trading apps
- Over 8,000 signals for copying
- Economic news for exploring financial markets
Registration
Log in
You agree to website policy and terms of use
If you do not have an account, please register