Why do you need them at all? Same thing about the trend.
Why do you need them at all? Same thing about the trend.
Why do you need them at all? Same thing about the trend.
Another religious philosophical question.
A neat religious one. People here believe in trends and flotsam
Support and resistance levels are formed by the volume traded at a given price/level. The higher the volume at a given price, the more significant this level is. The more confirmation points it has, the more significant it is. Plus, there are also option levels. So it is like this.
Volume - is it a standard MT indicator?
Any trading question can be categorised into two groups:
1. Subjective question ( rock painting ) - what I see is what I sing...
Objective question ( facts ) - which can be confirmed mathematically by ANY trader with the same output...
The support ( resistance )levels belong to the first group - the phenomenon in the mind of individual Trader, which cannot be repeated by other traders ( everyone sees his/her own picture of the world ... ).
Support (resistance) levels belong to the first group - a phenomenon in the mind of an individual trader, which cannot be repeated by other traders (everyone sees his own picture of the world...).
different from the real one, that's why they are lost...
The quote on the chart shows the price that is profitable for both buyers and sellers to convert.
When the quote goes up, it shows that in the market, the amount of money of buyers, who agree to buy is greater than the amount of money of sellers, who agree to sell.
When the quotation goes down, it shows that in the market, the amount of money of buyers who agree to sell is less than the amount of money of sellers who agree to sell.
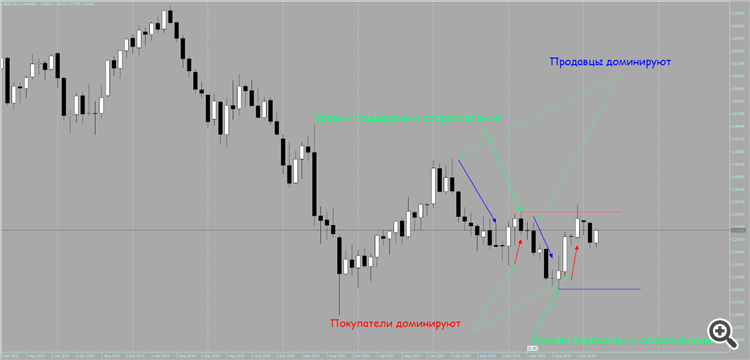
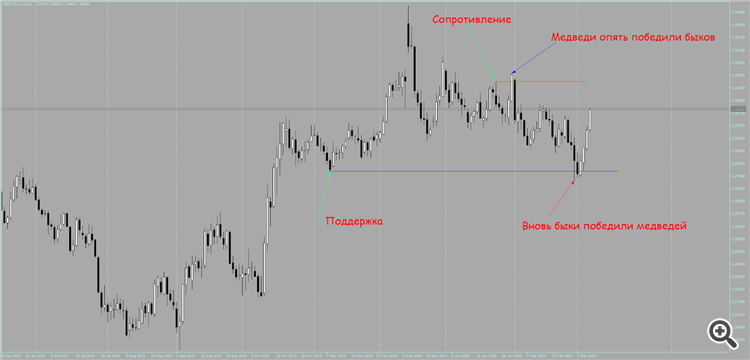
At the moment when direction of the quotation changes on the chart, support or resistance level is formed. The longer the level is on the chart, the stronger one of the market participants dominates the other.
Thus,the definition of the Resistance levelappears- it is the place where the bulls' dominance over the bears has been broken.
A Support level is where the dominance of the bears over the bulls has been broken.
Therefore it is a good time for the ТВх (entry point) when the price is currently moving towards a level, because we know for sure that on the history, at the support level the bulls have outnumbered the bears before, and at the resistance level the bears outnumber the bulls, there is a high probability that it will happen again.
When a quote goes up, it shows that in the market, the amount of money of buyers who agree to buy is greater than the amount of money of sellers who agree to sell.
When a quote goes down, it shows that in the market, the amount of money of buyers who agree to sell is less than the amount of money of sellers who agree to sell.
There is a mistake somewhere...
- Free trading apps
- Over 8,000 signals for copying
- Economic news for exploring financial markets
You agree to website policy and terms of use


The second most important question after trend definition: what are support/resistance levels and how do I define them?
I meet some articles pointing out how "right" and how wrong levels are determined. Some are satisfied with vague and watery classics, some suggest to place horizontal lines at the same distance from each other and they will show the same amount of breakdowns/breaks, tests/retests on history. In other words, the difference of opinions and as a consequence, the lack of definition of levels is evident.
So how do we correctly identify the support/resistance levels? And what are they?