A strategy with which to get into shorts. Usually before the cut-off, on stocks that can be shorted, JUNE JULY Harvest - page 11
You are missing trading opportunities:
- Free trading apps
- Over 8,000 signals for copying
- Economic news for exploring financial markets
Registration
Log in
You agree to website policy and terms of use
If you do not have an account, please register
Are we talking about funds or balance? Funds should not go into deficit. The balance can. I think you need to check with your broker specifically.
Only the opposite is true. Your balance is always in the black. Your cash may go into deficit. That's where the broker will help you with the cash).
It's not the rush we're talking about, it's the frequency of opportunities.
You can almost always find something on one of the 24 stocks.
And other strategies don't cancel out either. Let's say I have a GP hanging without any hedge.
By the way, about the rush. Opryvashka introduced a fee of 175p in May for providing information on the depository (in case there was any movement on it during the month). So, not to trade every month equals not to pay every month commission (and 175r on 428r profit for 3 months is a substantial fee) - sometimes haste will be needed.
Change broker. Mine has a deposit fee, but some pennies there.
And to top it all off, the preliminary analysis is done using tables like this.
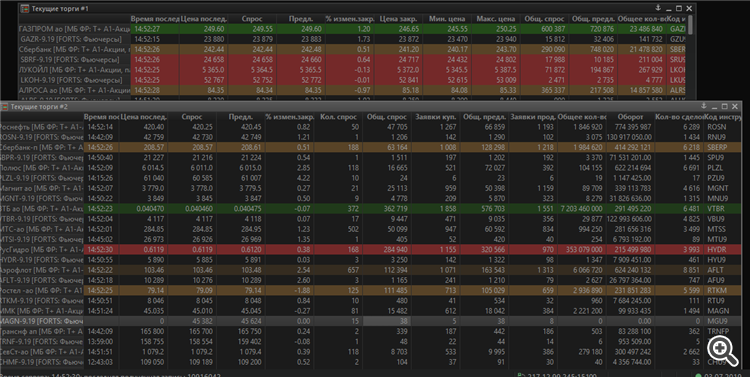
There is no need to automate anything here, as there are only 24 stocks in futures. Just one column to look at from time to time.Change your broker. Mine has a depository fee, but it's a penny.
And to top it all off, the preliminary analysis is done on tables like this.
There is no need to automate anything here, as there are only 24 stocks in futures. Just one column to look at from time to time.Can you put me in touch with your broker? I will see the rates.
We are in a forum of programmers! How not to automate!? :)
Can you also elaborate on the backwardation. If I, for example, now sell the stock (250.80) and buy the futures (24015) of Gazprom. I would be borrowing the stock from my broker for the same 78 days at 13% per annum (rollover of short positions).
Calculation: 25080+4584 = 29664p; Profit: 1065-696.7p = 368.4p or 1.24% (5.8% APR). It turns out that with backwardation it is possible to hedge this way (there will be profit), but we need to look for good returns?
Can you also elaborate on the backwardation. If I, for example, now sell the stock (250.80) and buy the futures (24015) of Gazprom. I would be borrowing the stock from my broker for the same 78 days at 13% per annum (rollover of short positions).
Calculation: 25080+4584 = 29664p; Profit: 1065-696.7p = 368.4p or 1.24% (5.8% APR). It turns out that with backwardation it is possible to hedge this way (there will be profit), but one should look for good yield?
Of course you can, as long as the profit exceeds the overhead and there is no cut-off on divs. It has to be substantial and short-lived for that to happen, and have a good enough reason to do so.
Here is the chart for the GP futures pair GP -6.19 before expiry, I think for the quarter. The chart shows the difference between the value of the futures and the BA in RUB.
During this time there were only 1-2 significant backwardations on which we could really play. And they were very short-lived. In general, it is possible, but it is not worth building up on it. Such gifts are quite rare.
We're in a programmers forum! How not to automate! :)
As for automation, while seemingly simple, the strategy is very multifactorial. But it is better to have some kind of software support for analysis.
Do I understand correctly that at cut-off "0" (x-axis) the backwardation was = 600p? How can this even be the case?
Do I understand correctly that at cut-off "0" (x-axis) the backwardation was = 600p? How can that even be?
I don't understand what you are talking about. And what is a cutoff?
Graph. On Y = Pf - 100*Pa, where Pf is the futures price, Pa is the stock price.
On X the minute data is for 3 months. The time flows from left to right. Expiration point - x >30k.
I don't know what you're talking about. And what is a cut-off?
Graph. By Y = Pf - 100*Pa, where Pf is the futures price, Pa is the stock price.
On X the minute data is for 3 months. The time flows from left to right. Expiration point is x >30K.
Cut-off point 0 = point 0 on x-axis. I have figured out the formula.
However, a question: according to the data I cited, it appears that the value of y = 24015-100*250.8 = -1065. You have no such value on the graph at all...
Cut-off 0 = point 0 on the X axis. The formula is figured out.
However, a question: according to the data I have given, it appears that the value of y = 24015-100*250.8 = -1065. You don't have such a value in your chart at all...
Where does it come from? futures 6.19. I wrote that.
Where's it coming from? Futures 6.19. I wrote that.
Ugh... Right:)