You are missing trading opportunities:
- Free trading apps
- Over 8,000 signals for copying
- Economic news for exploring financial markets
Registration
Log in
You agree to website policy and terms of use
If you do not have an account, please register
ahah crafty)))
yeah i think so too but the point is the correct evaluation of such a connection should give 50 on most of them. right? by the way have you tested your theory on the order and 8 minutes?
That's where I started.
on M1 you can clearly see the movement in that time, from and to, and... then a flat.
Just don't count the candles, look at the time.
no index will help you until you start to see what's going on and why on the chart
That's where I started.
on M1 you can clearly see the movements during this time, from and to and ... then a flat
just don't count the candles, look at the time.
The sticky instrument will not help you unless you can see on the chart what's going on and why
i have a very intensive experience of five years, i've been struggling with the same regime as Alexander_K has been struggling with for the past two weeks, except i've been programming in two languages and created my own terminals - similar to MT4 on java and robots with indicators on mql.
I have a really bold question:)
Do you really think you can tell "why" a movement is happening on the chart?)
I have a very busy five years, I've been pushing for the last two weeks in about the same way that AlenaK has been pushing for about five years.
I have a covaaaaar question:)
Do you really think you can tell "why" a movement is happening on a chart?)
the chart is already an indicator of the trading history
what is it that makes the price move?
it's basically an overestimation, as close to the price as possible
here's how it is from this point of view
the simplest description, the equivalent formula for price increase: delta_price=sellVolume-buyVolume
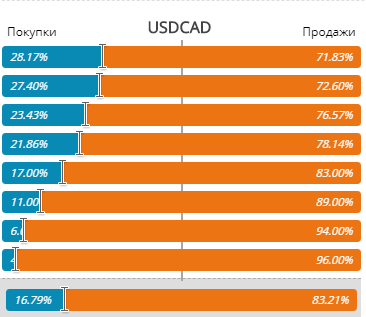
look where the USDCAD is now and look here:
Forum on trading, automated trading systems and trading strategies testing
FOREX - Trends, predictions and implications 2018
sterva, 2018.12.20 20:46
There's only one thing that confuses me with the Canadian.
I reversed it, but.......
All in all - nothing new, but loses as always most
;)
the chart is already an indicator of the trading history
which is what makes the price move.
mostly - overestimated, as close to the price as possible unreasonable risk
I mean, from this point of view.
the simplest description, the equivalent formula for price increase: delta_price=sellVolume-buyVolume
look where the USDCAD is and look here:
In general - nothing new, but it loses as always to the majority.
;)
I remember those charts when we tried to decide if the price is random or not).
There are only logical questions that can be answered, except for the 3rd one
3) because it is promising to buy on hawks, but only until the sellers run out of deposits, and then there will be those who failed to buy
of course
I've noticed this for about 6 years, but the formula is a nut.
yes, there are questions based on naked logic that will find their answers, except for the 3rd one.
3) because buying on the hay is promising, but until the sellers have their deposits wiped out, and then there will be those who bought unsuccessfully
But then there is also a high risk of merging in the multi-level market noise... Because of the struggle between conventional 'buyers' and 'sellers'.
In that proportion, the fight is irrelevant and the price is definitely going against the sellers:
In this proportion the struggle is irrelevant and the price is definitely going against the sellers:
Yes there is and it's very simple called the coefficient of variation.)
You won't believe me, but whenever I hear the word average... ...I'm instantly terrified.
You can't apply this formula to forex, because averaging of any kind usually leads to late buying or selling and there will be a loss.