You are missing trading opportunities:
- Free trading apps
- Over 8,000 signals for copying
- Economic news for exploring financial markets
Registration
Log in
You agree to website policy and terms of use
If you do not have an account, please register
What is interesting is that in the post above I used a multiplier of 1.6, which was strangely coincidental, but it was Chegevara who kept mentioning that number.
When looking at the quantile deviation, it is no coincidence that we used a deviation with 90% confidence
as an example at
. The point is that the quantity d0.90 has
a unique property, which is that only
the quantile deviation d0.90 has a one-to-one relationship with
the standard deviation σ (which will be discussed
below) as d0.90 ≈1.6σ for a very wide class of the most
used distribution laws. Therefore, in the absence of
data on the form of the distribution law, it is recommended to use a confidence
probability of 0.90 to estimate the quantile deviation
.
Chapter 1: Probabilistic description of random variables
S.V. Bulashev. Statistics for Traders.
When considering quantile deviation, it is no accident that we have
we have used the 90% confidence level deviation as an example.
probability. The fact is that the value of d0.90 has
the unique property that only the quantile deviation d0.90
quantile deviation of d0.90 has a one-to-one relationship with the
to the standard deviation σ (which will be discussed below) as d0.90.
below) as d0.90 ≈1.6σ for a very wide class of the most
used distribution laws. Therefore, in the absence of
of the distribution law, it is recommended to use the confidence level to estimate the quantile
deviation, the use of a confidence level of
probability of 0.90.
Chapter 1: Probabilistic description of random variables
S.V. Bulashev. Statistics for Traders.
with both hands! =)
http://dodiplom.ru/ready/119533
Read this if you want, it says it very well what comes from where and where to where in terms of the philosophical side of the issue.
look for the bifurcation point gentlemen)
http://dodiplom.ru/ready/119533
Read this if you want, it says it very well what comes from where and where to where in terms of the philosophical side of the issue.
look for the bifurcation point gentlemen)
Thanks, buddy!
We're looking for gold like the corsairs. I'm already walking like a ragamuffin, my neighbours will soon rat me out to the police - but I'm not giving up.
Thanks, mate!
We're looking for gold like corsairs. I'm walking around like a ragamuffin, I'm about to be turned in to the cops - but I'm not giving up.
XD it happens XD
i'm just saying, it's the wrong direction...
think about it...
the market has 98% of random overlapping synergies that are simply unrealistic to track and even more unrealistic to make money from them...
that leaves the two percent that make more than 90% of all profits...
This is true regardless of what we think or not...
we don't have to investigate everything, but those 2% of movements are easy to spot even by eye, not to mention the maths.
What's going on in front of those 2?
Why go from theory to the market and not the other way around?
Thanks, mate!
We're looking for gold like corsairs. I'm walking around like a ragamuffin, my neighbours will soon turn me in to the cops - but I'm not giving up.
What, they're holding up wages at the factory?
Я
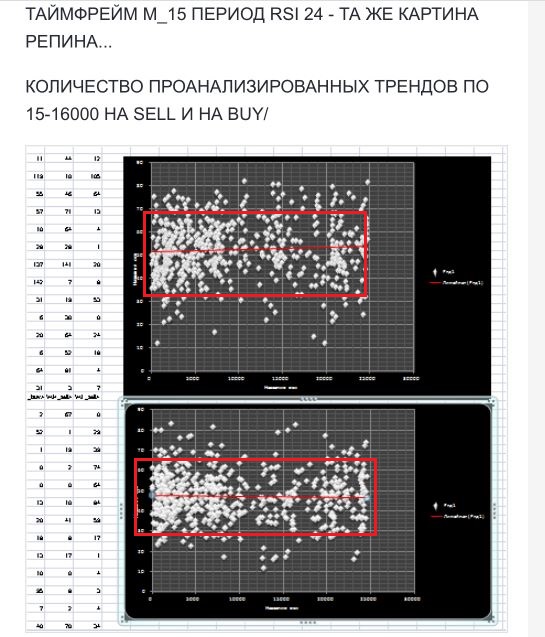
Once a long time ago... when I didn't know much I analysed all trends that can give a profit in the market relative to what the indicator shows when the trend emerges. The conclusion is very simple and adequate - 90-95% of all trends, or as I like to say "directional moves", are born in a state of complete uncertainty and tend to complete chaos. So no tools to determine the direction of price moves will give the results along the way and the last point was made by you, Alexander_K, when you examined asymmetry at my request).
To put it simply - the moment when you find the entry point according to the information data will not work out probably in about 80% of cases... because the process has already occurred and it is more likely to stabilize than the further such a sharp uninterrupted movement.
As I said before 2% is very little to analyze anything for the current moment in time.
It may sound paradoxical and bitterly necessary to know in advance... unfortunately...
Я
Once a long time ago... when I didn't know much I analysed all trends that can give a profit in the market relative to what the indicator shows when the trend emerges. The conclusion is very simple and adequate - 90-95% of all trends, or as I like to say "directional moves", are born in a state of complete uncertainty and tend to complete chaos. So no tools to determine the direction of price movement will give the results, and the last point was made by you, Alexander_K, when you examined asymmetry at my request)
:)) Yes, both yours and just nonparametric (and even more so parametric) asymmetry give little effect. I've said more than once that you need 1, just one magic key. Asymmetry, kurtosis, correlation.... Everything is close together and everything is just a little bit wrong. At the crucial moment they fail...