From theory to practice - page 547
You are missing trading opportunities:
- Free trading apps
- Over 8,000 signals for copying
- Economic news for exploring financial markets
Registration
Log in
You agree to website policy and terms of use
If you do not have an account, please register
Maybe someone can show me how distributions look like on a logarithmic scale, I'm looking for it and can't find it.
Don't look it up, get yourself an R and R-Studio and make any graphs you want.
Maybe someone can show me how distributions look like in a logarithmic scale, I'm looking for it.
Interested. Couldn't find it either, although far from always the ranges on histograms of relative frequencies represent well visually the data on which they are plotted. But I came across a very interesting figure at http://www.math.wm.edu/~leemis/chart/UDR/UDR.html with connections of different types of distributions to each other. I have never seen so many distributions at once.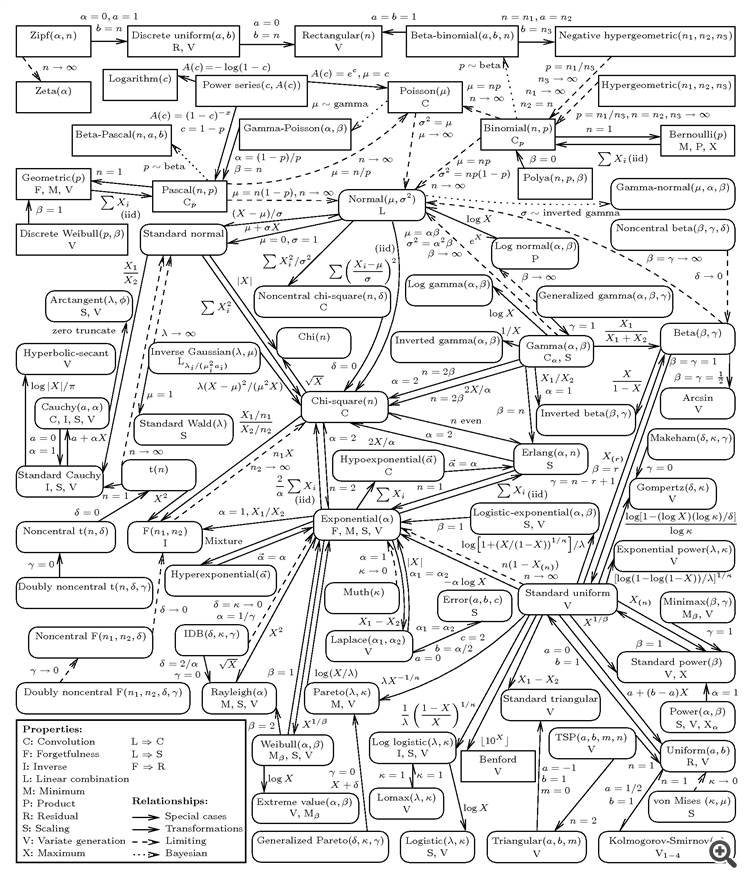
What a lot of work has gone into collecting their properties. And what is the layout of their mutual arrangement, so that the arrows are not long and not broken...
P.S. It turns out that on the site you can find in this figure, a pdf text for each distribution with formulas for its parameters, and access to the needed VIKI. A whole reference book.
Interesting. Couldn't find it either, although far from always the ranges on the relative frequency histograms are a good visual representation of the data on which they are plotted. But I came across a very interesting figure at http://www.math.wm.edu/~leemis/chart/UDR/UDR.html with links between different types of distributions. I have never seen so many distributions at once.
What a lot of work has gone into collecting their properties. And what is the layout of their mutual arrangement, so that the arrows are not long and broken...
P.S. It turns out that on the site you can find in this figure, a pdf text for each distribution with formulas for its parameters, and access to the needed VIKI. A whole reference book.
I don't see a Pearson distribution. It would make it very difficult to arrange the arrows.
The sorcerer is back...
I wash away tears of joy and sorrow...
For me, it's too late; for those who suffer, it's time to give them hope.
So it's in the middle, chi-square, by the way, I saw this scheme on hubra in the comments of an article. Thank you.
No, the Pearson distribution is a broader concept than chi-squared. I didn't write about possible problems with the arrows for nothing.
There hasn't been a phase portrait yet...
I'm waiting for the v.videos from Misha-Teacher. But so far only learns to shoot at sparrows)))). Probably preparing for something...
He's earning his deposit by hard work... As a janitor, apparently. Just like Fa.
And Doc has disappeared... Anyway, the summer had taken its toll on our ranks.
That's how people earn their bread. But it's quick.
The theory is good, but the practice fails)