You are missing trading opportunities:
- Free trading apps
- Over 8,000 signals for copying
- Economic news for exploring financial markets
Registration
Log in
You agree to website policy and terms of use
If you do not have an account, please register
Is 5 trades a statistic? it's a statistical error.
as Chebyshev told you, what should be the sample length? 1440 values.
:)))) Exactly. More precisely - a sample of 300 trades (covering 99% of a normal distribution) is necessary to judge the stability of the TS.
By the same principle, taking into account the excess, ran "dragon" GBPJPY for 2018.
Total: 10 trades (+7/-3). Profit: +200 pips.
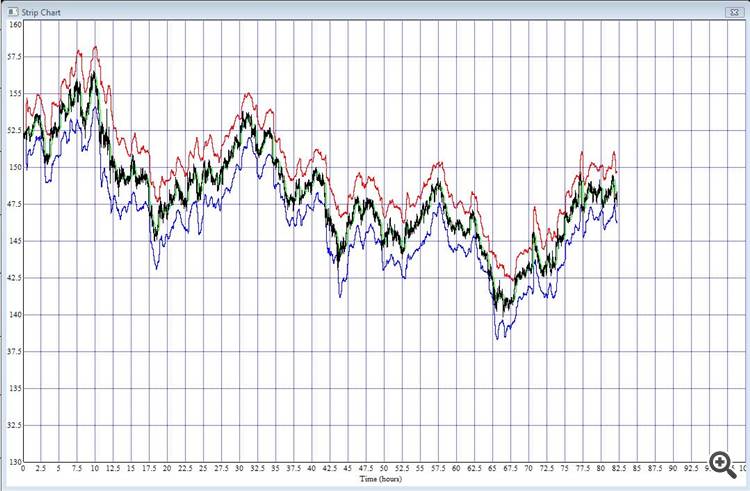
Sliding window - day (1440 values CLOSE M1).
:)) I'll put it on real. Ein moment...
replied in person
Interesting. Thank you.
A must-read:
https://en.wikipedia.org/wiki/Kurtosis
You should read the English-language page, paying special attention to the interpretation of the kurtosis.
It seems to me that the kurtosis of the sliding increment distribution is the trend/float parameter that I've been looking for for a year...
In fact, kurtosis is a measure of the deviation of a distribution from normal. A kind of counterpart to non-entropy...
Huh? What are you saying? Where are the results? Oh, hell, no results. You'll have to wait.
Did a little bit of foolproof research...
What time was the Maximum Day in the last 60 days (GMT+3timezone ) formed?
What time theMinimum of the day was formed during thelast 60 days (GMT+3 timezone)
The range between the maximum and minimum of a day in hours.
Did a little bit of foolproof research...
What time was the Maximum Day in the last 60 days (GMT+3 timezone) formed?
What time did theMinimum of the day formin the last 60 days (GMT+3 timezone)?
The range between the maximum and minimum of a day in hours.
Did a little bit of foolproof research...
What time was the Maximum Day in the last 60 days (GMT+3 timezone) formed?
What time did theMinimum of the day formin the last 60 days (GMT+3 timezone)?
The range between the high and low of a day in hours.
Good movements start at +/- 11:00, 15:00, 17:00, 22:00 (Moscow time). If many guesses stand in the direction of the expected movement, this will be the low/max of the day in the opposite direction. The maximum/maximum of the day after the movement can be smeared from +/- 18:00 to the end of the day.