From theory to practice - page 526
You are missing trading opportunities:
- Free trading apps
- Over 8,000 signals for copying
- Economic news for exploring financial markets
Registration
Log in
You agree to website policy and terms of use
If you do not have an account, please register
Interesting. Firstly, it is inaccurate, we do not minimize "squares", but "sum of squares". Second, if you want to give greater value to the last points, it is done simply, in the minimized sum take not just squares, but weighted squares, that is multiplied by some positive weighting coefficients. Their values at the end of the array should be larger, and at the beginning - smaller. For example, for numbers of points i from 1 to n, weights equal to q^(n-i) with q < 1, give squares of deviation multipliers similar to weights of courses in an exponential moving average. Often their sum is also made equal to one, if we want to compare different approximations by the value of the minimum weighted sum of squares of deviation.
And what is the "centre" for a curvilinear channel whose boundaries are described by different types of formulas? Or at least for the first variant, by exponential functions?
If it is simply the midpoint of the segment from the penultimate value in the series to the last, then it is sufficient to make the deviation weights in the last two points of the series very large. You need some other requirements for the deviations, otherwise the problem is understated.
Well, you see the centre in the horizontal channel, don't you?
is the same here. you should select the function so that its last point appears to be in the centre of the price channel by eye.
And what is the "centre" for a curvilinear channel whose boundaries are described by different types of formulas? Or at least for the first variant, by indicative functions?
If you need it so precisely: take the upper part of the circle, apply a certain noise to it. this will be the time series. then regress the function on this time series.
if the end of the function graph coincides with the end of the circle graph that you used to construct your time series, it will be the "centre of the channel".
What's the use of calculating the "centre" at the last point?
How is it useful? The indicator is a sliding indicator. only the extreme point is taken.
is the same as the dash. it's the middle line, from which only the last point was taken.
with me, a channel is noise superimposed on a particular trajectory.
A trading channel trajectory can be:
Mash can only cope with a horizontal trading channel.
It is important to find a function that can handle all these types of trajectories.
Well, in a horizontal channel, you see the centre, don't you?
It's the same here. You have to pick the function so that its last point is in the centre of the price channel.
If you need it so precisely: take the upper part of the circle, apply a certain noise to it. this will be the time series.
If the end of the function graph coincides with the end of the circle graph that you used to plot your time series - this will be the "centre of the channel".
What's the use? It's a moving indicator. Only the extreme point is taken.
It's the same as a moving wave. it's the middle line from which you took only the last point.
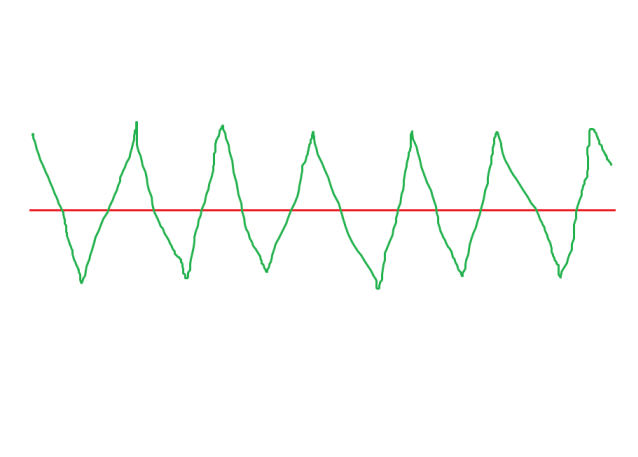
How the red line is constructed, I don't understand. If you smooth out the course points (green in the figure) with the same Excel tools (build a trend by linear filtering over 5 points, you get a curve that is much closer to the course than the (red) horizontal line, and there is no such simple midline anymore.
If you already have a way of classifying the course curves and only need to find the ends of the middle lines, then the classification itself (circle, horizontal straight line, sloping straight line, etc.) will determine the choice of the approximating function. However, requiring it to also pass through a single, endpoint of the course is very strange. Either approximate the points over the entire considered interval or just take the last one - these are different tasks.
The way you told about the circle and noise is not just a function approximation, but a dependence reconstruction (unknown in advance, unlike the case of the circle), which is much more complicated. If interested, search here on the Wapnick forum.
P.S. About "The trajectory of the trade channel can be:". I read some famous philosopher of the early 20th century saying that the hardest thing to determine is what's behind the word "this". Do you think your classification of trajectories generates the same impression in all readers? You can characterise the properties of each of the trajectories you show in the figure in very different ways..."Extrapolations by polynomial and Fourier methods are of a completely different nature. Fourier extrapolation can only be applied to a flat market due to its periodic nature (the line is the sum of sinusoids of different frequency, phase and amplitude) and it keeps coming back.
Whereas polynomial extrapolation, on the contrary, is good in a trend, as it keeps trying to "fly" down or up due to its degree nature. "Nikolay Semko
There's more:
So there is very much merit in combining the two methods. A simple summation will not suffice here, of course. But I have a clear idea of how best to combine them
Either approximate the points over the whole considered interval, or just take the last one - these are different tasks.
Approach points on the whole considered interval and see where the last point will fall.
How the red line is constructed, I don't understand. If to smooth the points of course (green on the figure) by means of the same Excel (to build a trend by linear filtering by 5 points, you will get not a (red) horizontal line, but a curve, much closer to the course, and such a simple middle will not be there any more.
it's just an average line. sum of prices / by their number. don't bother)
Do you think your classification of trajectories generates the same impression in all readers? You can characterise the properties of each of the trajectories you show in the figure in very different ways...
well I use Polynomial, so they are "different parts of a parabola".

You could also try using an arc, but I don't know how to do a regression on it.
Can you derive the arc equation from here to score it in excel?
http://sci.sernam.ru/book_geom.php?id=39
there is still a sequel:
The problem remains the same, we need to find a function, the last point of which will be in the centre of the price channel.
There is no such function, you need nonparametric methods, the simplest is SMA, the most complicated is here
https://www.mql5.com/ru/forum/221552/page523#comment_8560475
The trajectory of the trading channel can be:
The trick is that the trajectory can suddenly change and then all approximations go to hell.
You can see the centre in a horizontal channel, right?
The same here. You can pick the function so that its last point is in the centre of the price channel.
If you need it so precisely: take the upper part of the circle, apply a certain noise to it. this will be the time series. then regress the function on this time series.
If the end of the function graph coincides with the end of the circle graph that you used to plot your time series - this will be the "centre of the channel".
What's the use? It's a moving indicator. Only the extreme point is taken.
It's the same as a moving wave. it's the middle line from which you took only the last point.
I don't quite get it, why don't you like the ANC method and polynomials? The channel is easy to build...
Here's another chart for you. Parabolic interpolation, channel width - 0.9 of the maximum envelope