Any questions from newcomers on MQL4 and MQL5, help and discussion on algorithms and codes - page 798
You are missing trading opportunities:
- Free trading apps
- Over 8,000 signals for copying
- Economic news for exploring financial markets
Registration
Log in
You agree to website policy and terms of use
If you do not have an account, please register
nothing, empty
Askhere.
Askhere.
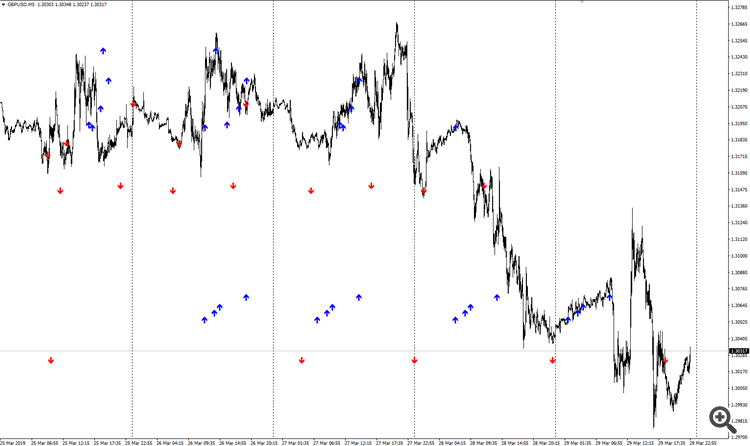
If it helps, it should draw arrows, on the euro, on the euro-yen, the aussie, on the others it does not
If it helps, it should draw arrows, on the euro, on the euro-yen, the aussie, on others it does not
Just a guess.
There is such a value in the settings:
And then in OnInit():
I see that daily bar data is used for the calculation:
Are you sure there are enough bars on the symbols where there is no drawing? Put a smaller value in so_slowma variable - at least 100. If there will be rendering, then you don't have enough historical data.
It's just an assumption that came to mind the first time I looked at the code. And it may be wrong. But you need to check it first.
How can I make a rectangle https://docs.mql4.com/ru/constants/objectconstants/enum_object/obj_rectangle be drawn on top of another rectangle without mixing their colours?
Here, for example, a later horizontal line is drawn on top of an earlier horizontal line without mixing their colours, but I don't see what causes the difference from rectangles.
Thanks.
Just a guess.
There is such a value in the settings:
and then in OnInit():
I see that daily bar data is used for the calculation:
Are you sure there are enough bars on symbols where there is no rendering? Put a smaller value in so_slowma variable - at least 100. If there will be rendering, then you don't have enough historical data.
It's just an assumption that came to mind the first time I looked at the code. And it may be wrong. But you need to check it first of all.
That is, because I take data from the daily data once in the code, the indicator will not draw the first 233 days?
No, it is not. This value indicates from which bar number the indicator will start drawing on the chart. But this number of bars is used to calculate the moving average. If there are less bars in the chart, the MA will not be calculated. In order to avoid this situation, at line 73, the code contains return from OnCalculate() in case of absence of bars for calculation:
Well, about the daily data - it may not be present, but it is more like "continuation of history"...
No, it is not. This value indicates from which bar number the indicator will start drawing on the chart. But this number of bars is used to calculate the moving average. If there are less bars in the chart, the MA will not be calculated. To avoid this situation, in the code, at line 73 we wrote return from OnCalculate() in case of absence of bars for calculation:
Well, about the daily data - it may not be there too, but it's more like "continuation of history"...
The pound, for example, has more than 1000 bars on the daily and on m15, but it does not draw...
Well the pound for example, both on the daily and on m15 is over 1000 bars, but it doesn't draw...
You have the source code. Print out the values of all the variables in the log and see what they get.
You have the source code. Print out the values of all the variables in the log and see what they get.
Where is this coming from?

Where does this come out of?