FOREX - Trends, Forecasts and Implications (Episode 17: July 2012) - page 459
You are missing trading opportunities:
- Free trading apps
- Over 8,000 signals for copying
- Economic news for exploring financial markets
Registration
Log in
You agree to website policy and terms of use
If you do not have an account, please register
Friday's, the week's and the contract's trades:
Friday's, the week's and the contract's trades:
We'll be on our way to the 25th figure....
Well, you see, everything is clear as day and there's no need to guess or sneak)))
And these are our salesmen:
I drew it a long time ago:
Mine is just starting)))) Or rather continues:
The euro is the same at 1.5750. \Now you can laugh and throw stones))))
Now that's a long shot! (or maybe it's time for a doctor's appointment)
sell it... You and I are on opposite sides as usual, you on the left and me on the right
Martingeil 27.07.2012 17:55
tema077:
why a divorce? and what difference does it make white or black candle, i sometimes enter at the very peaks almost on the tips of low or high... so....
The Hanged Man is appropriately a bearish reversal pattern, which can also indicate a top or upper resistance limit. When price rises, the formation of a hung candle shows that sellers are beginning to outnumber buyers. A long lower shadow indicates that the sellers were "pushing" the price down during the session, but the buyers were able to pull the price back up, but only to the opening price. We get a signal that there are not enough buyers left to provide an upward price trend.
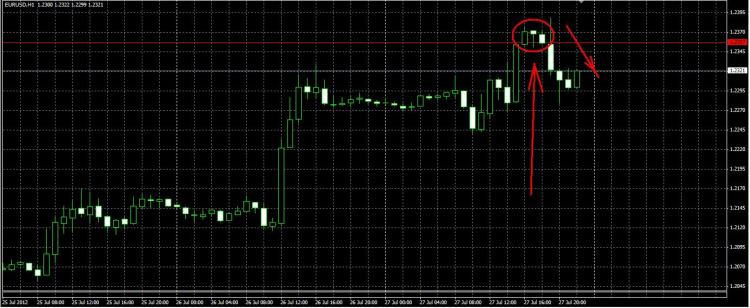
Criteria for determining the Hanging Man pattern
Long lower shadow - 2 to 3 times longer than the body
Very short upper shadow or no shadow
The body is in the upper part of the trading range
The colour of the body does not matter, although a black body is more bearish than a white one
so that's probably why i think so )
Martingeil 27.07.2012 17:55
tema077:
why a divorce? and what difference does it make white or black candle, i sometimes enter at the very peaks almost on the tips of low or high... so....
The Hanged Man is appropriately a bearish reversal pattern, which can also indicate a top or upper resistance limit. When price rises, the formation of a hung candle shows that sellers are beginning to outnumber buyers. A long lower shadow indicates that the sellers were "pushing" the price down during the session, but the buyers were able to pull the price back up, but only to the opening price. We get a signal that there are not enough buyers left to provide an upward price trend.
Criteria for determining the Hanging Man pattern
Long lower shadow - 2 to 3 times longer than the body
Very short upper shadow or no shadow
The body is in the upper part of the trading range
The colour of the body does not matter, although a black body is more bearish than a white one
so that's probably why i think so )
The difference is that a candle without volume is like a woman in a burka, you can't look at it, you can't see anything)))
sell it... You and I are always on opposite sides, you on the left and me on the right.
sell - buy - sell (who cares) we are not even in the 37th (or maybe the 1.37 is already in history - the former Euro) do not pass your nonsense on me (from 8 pips demagoguery).
(dop. and also a persecution mania ))))