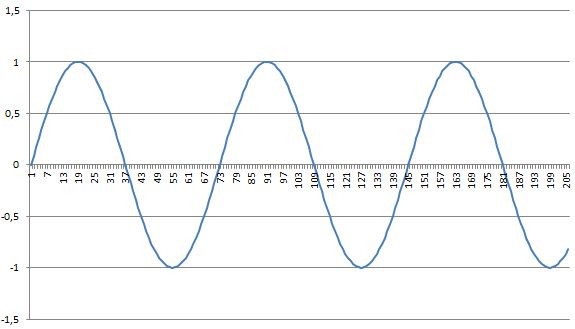
panzernik:
Have you understood my question yet?
Not to Google, you'll be sent further away :)Have you understood my question yet?
Your question: what is the average (with any period) of a sine wave?
DmitriyN:
Not Google, they'll send you further away :)
Your question: what is the average (with any period) of a sine wave?
Not Google, they'll send you further away :)
Your question: what is the average (with any period) of a sine wave?
A straight line, so what?
panzernik:
Straight, so what?
How is it straight? It can't be. You see, you need to change your 'graphical understanding'.
Straight, so what?
panzernik:
Straight, so what?
Straight, so what?
This will only be the case if there are overlapping periods.
DmitriyN:
Like a straight line? It can't be. You see, you need to change your "graphical understanding".
It's a special case.Like a straight line? It can't be. You see, you need to change your "graphical understanding".
DmitriyN:
You too, Vadim.
Easier practically, but let's be theoretical. What is MA? Arithmetic mean. Therefore, when periods of sine wave and MA coincide, we obtain straight line. Because the sum (integral) of one period of a sine wave is zero. And it, no matter how you divide it, all we will get zero + the constant component.
You too, Vadim.
Zhunko:
Here.
What do you do when you optimise an EA?
That's right.
When you optimise an EA, you also find some optimal MA.
That's right.
When you optimise an EA, you also find some optimal MA.
panzernik:
Imagine that the price chart is a sine with a constant period and a constant amplitude. How would you trade on such a chart?

DmitriyN:
Buy low, sell high. And vice versa. I don't see where you're going with this - just say it straight, don't chew it up.
Imagine that the price chart is a sine with a constant period and a constant amplitude. How would you trade on such a chart?
panzernik:
Buy low, sell high. And vice versa. I don't see where you're going with this - just say it straight, don't chew it up.
Buy low, sell high. And vice versa. I don't see where you're going with this - just say it straight, don't chew it up.
The phrase "Buy cheaper, sell dearer" has a sacred meaning. Cheaper than what? More expensive than what?
And if you don't spell it out, it doesn't make sense at all.
I resign, sorry I rambled on.
You are missing trading opportunities:
- Free trading apps
- Over 8,000 signals for copying
- Economic news for exploring financial markets
Registration
Log in
You agree to website policy and terms of use
If you do not have an account, please register
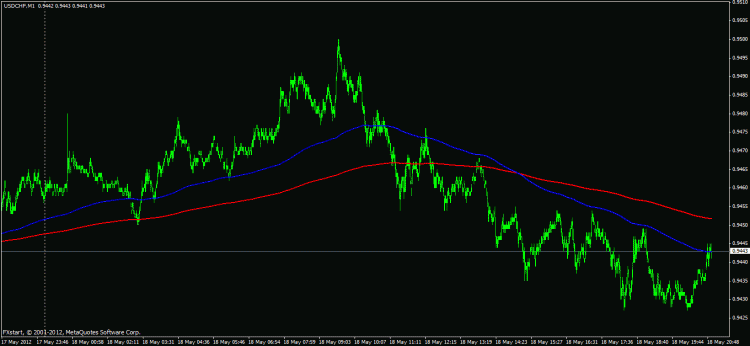
There are 2 averages on the chart - the blue one is more accurate in its price envelope. Purely practically, it is inconvenient to make an assessment of the chart every time and then readjust the moving averages. Although, the human eye is able to do it quite well and accurately.
Have you understood my question yet?