Portfolio Currency v2 indicator
Working principle.
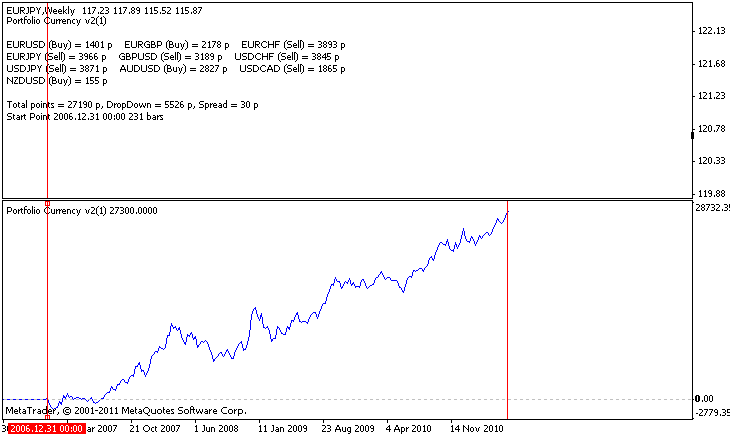
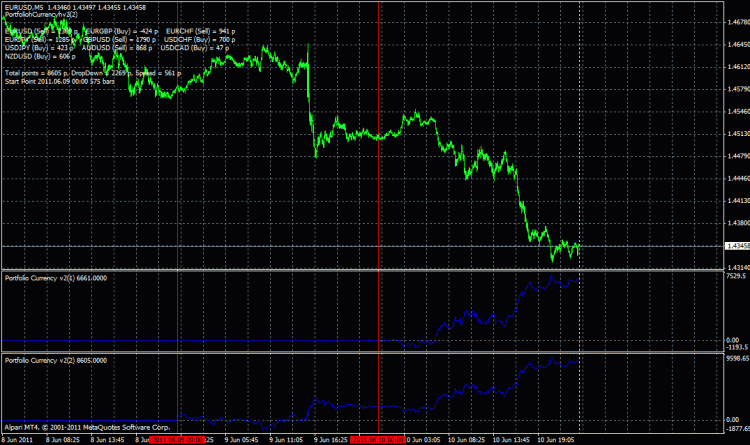
We set the common reference point for all instruments - the open price of the bar, which is marked with the leftmost vertical line. A curve is drawn to the right of this line, which shows the sum of deviations of each instrument from the reference point in points.
As the pip value of the trading instruments is different, the pip value of each currency pair is multiplied by the ratio of the pip value to the average pip value.
Indicator parameters:
extern int Complekt = 1;      // На одном графике можно загрузить несколько индикаторов с разным значением параметра.
extern int Period.Opt = 72;   // Временной интервал для поиска оптимального направления по каждому инструменту.
                              // Результат поиска подставляется для расчета и
                              // записывается в файл с именем вида "123456 Portfolio(0).csv",
                              // где 123456 - номер счета, число в скобках - значение Complekt
extern string File = "para.csv";// Имя файла, в каждой отдельной строчке которого записан инструмент и
                                // направление торговли. Например, EURUSD;0, где 0 - покупка, 1 - продажа.
extern bool Info=true;          // Вывод информации на экран от последнего загруженного индикатора.
extern bool Mid.Points=false;   // Вкл/Выкл усреденное значение стоимости пункта
extern color  MarkColor = Red;  // Цвет вертикальных линий
The indicator works in 2 modes:
- automatic selection of the optimal trading direction for each instrument (parameter Period.Opt is greater than 0);
- manual selection of the reference point and trading direction for each instrument (parameter Period.Opt = 0).
The first mode is useful for selecting the trading direction for each instrument. The result is written in the file, which can be later used for manual mode.
The second mode is useful for managing positions, i.e. setting open times and directions.
Where to buy and where to sell?
Don't twist it, point your finger! (с)
And where to buy and where to sell?
Download the indicator Portfolio Currency v2.
For it to work correctly, you need to prepare an additional file specifying the name of the instrument and the direction of trade (0 - buy, 1 - sell).
For example,
EURUSD;1
EURGBP;0
EURCHF;1
EURJPY;1
GBPUSD;1
USDCHF;0
USDJPY;0
AUDUSD;1
USDCAD;0
NZDUSD;0
The number of trading instruments is not limited.
Select TF. Prices with fixed open/close time of the candle are used in the calculation. The smaller the TF, the more accurate the calculation is. Make sure that the quotes history for the selected TF is downloaded for all instruments that are part of the portfolio (see Quotes Archive, the "F2" key).
The Period.Opt parameter shows the time interval at which the indicator determines the trading direction for each instrument in the portfolio. The direction of trade is defined as the positive difference between the last candle close price (right vertical line) and the opening price of the starting candle (left vertical line).
Once we have determined the direction of trade - we open a position.
When the Period.Opt parameter is 0, the vertical lines can be moved. The left line is set at the opening candlestick, and the right one is shifted to the future. The indicator will show the total number of pips that the entire portfolio of trading instruments has passed since the start.
Download the Portfolio Currency v2 indicator.
For it to work correctly, you need to prepare an additional file specifying the name of the instrument and the direction of trade (0 - buy, 1 - sell).
For example,
EURUSD;1
EURGBP;0
EURCHF;1
EURJPY;1
GBPUSD;1
USDCHF;0
USDJPY;0
AUDUSD;1
USDCAD;0
NZDUSD;0
The number of trading instruments is not limited.
Select TF. Prices with fixed open/close time of the candle are used in the calculation. The smaller the TF, the more accurate the calculation is. Make sure that the quotes history for the selected TF is downloaded for all instruments that are part of the portfolio (see Quotes Archive, the "F2" key).
The Period.Opt parameter shows the time interval at which the indicator determines the trading direction for each instrument in the portfolio. The trading direction is defined as the positive difference between the last candle close price (right vertical red line) and the opening price of the starting candle (left vertical red line).
Once we have determined the direction of trade - open positions.
When the Period.Opt parameter is 0, the vertical lines can be moved. The left line is set at the opening candlestick, and the right one is shifted to the future. The indicator will show the total number of pips that the entire portfolio of trading instruments has passed since the start.
It would be useful to include an example of a file in the archive, or, better yet, to create a default file that can be edited later.
It would be better to put an example file in the archive as well, or to create a default one, which can be edited later.
The archive contains an example file "123456 Portfolio(1).csv".
The default file cannot be created, as its main role is to define the portfolio's trading instruments.
The average point value is the sum of all point values divided by the number of instruments.
Did I get it right?
- Free trading apps
- Over 8,000 signals for copying
- Economic news for exploring financial markets
You agree to website policy and terms of use


It's not the first time a topic like this has come up on the forum and after a heated discussion it has fallen silent. I hope it develops in the future.
The main rule is to open/close all positions simultaneously. You can add positions for separate trading instruments. Closing of all positions after the specified level of total profit.
When trading with one instrument, there are only 2 possibilities: profitable and losing. The probability is 50/50. Spread increases the probability of the losing variant.
A portfolio of trading instruments reduces the probability of selecting the worst/worst option - this is when all positions turn out to be loss-making/profitable after some time. There are 1024 variants for 10 currency pairs. At a certain time interval of quotes history, each variant has a trend and a correction. If we draw a chart, where the horizontal line represents variant numbers and the vertical line represents the final values of the trend sorted in descending order, we will get the following picture.If we add one or two symbols, we have only 2 variants: the most profitable and the most losing one. The probability of choosing one of these variants decreases.
Probability = 1 / (2^N) * 100%,
where N is the number of trading instruments in the portfolio.
50% or 512 options are profitable and 50% or 512 options are unprofitable. Having a spread increases the number of losing options. Between the variants with maximum and minimum results there are variants that have results close to zero. I have drawn the graph as a sloping line. In fact, it will be a curve that is symmetrical to the horizontal axis. From this it can be assumed that more than 50% of the options have a balance curve that varies within a limited range around the horizontal line.
Suppose, for example, that the variant with the maximum result has been chosen at a certain time interval of the quotes history. This variant has the maximum value of correction, which shows the range of the balance curve variation. In the future, the selected variant may still show the maximum result, but it is most likely to move to the group of variants with a limited range around the horizontal line.