[Branch closed!] EURUSD - Trends, Forecasts and Consequences (Episode 4) - page 173
You are missing trading opportunities:
- Free trading apps
- Over 8,000 signals for copying
- Economic news for exploring financial markets
Registration
Log in
You agree to website policy and terms of use
If you do not have an account, please register
The high will be tomorrow according to Gann, right?
I'm watching...
Yes tomorrow - but I burned myself going against the trend with this data - if I open with the trend and rainbow then there will be mega profits -
But I have a disappointment so far - and lotsies on EUR GBP - a dead trend for 4 days ) up and I keep selling and selling
If in a trend to buy from low points - then in a day I have already calculated it was possible to make 80 pips - from 1 pair
But to be honest, it works - but we use it wrongly - if the trend is up then in low prices will stand still or a divergence - after the low day it goes up.
even made screenshots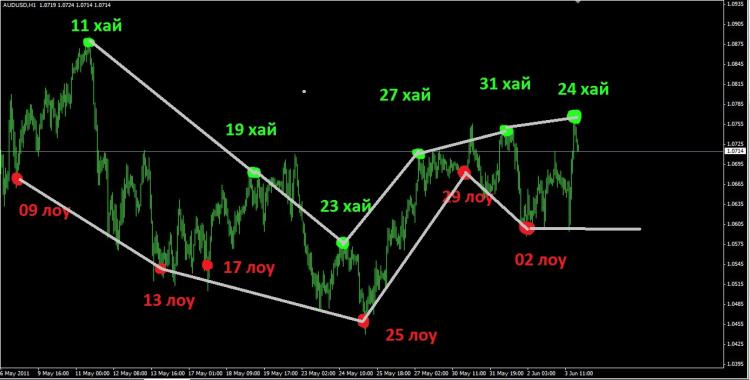
Yes tomorrow - but I burned myself going against the trend with this data - if I open in the trend and rainbow then there will be mega profits -
But so far I have disappointment - and lotsies on EUR GBP - a dead trend for 4 days) up and I keep selling and selling
If in a trend to buy from low points - then in a day I have already calculated it was possible to make 80 pips - from 1 pair
Yes tomorrow - but I burned myself going against the trend on this data - if I probably open in the trend and rainbow then there will be mega profits -
But so far I'm disappointed - and suckers on EUR GBP - dead trend for 4 days ) up
Imho, today or tomorrow there will be a bounce on the fan as well
Without the quid, there are no prices - you don't know how much the euro or the pound is worth - but between them, how much they are worth. Euro/dollar and pound/dollar - that's what the Euro/lb is all about. There's no trend, no resistance - there's nothing (I don't).
I chose this pair as the most liquid - pullbacks, breakdowns - reversals - but this and last week surprised me - it's all news - with them, the market is inflated and artificial rather than natural -
I rechecked gan - again a new trick has come up on history - the real reversals are when the price makes 360 degrees - and in between the divergences and pullbacks here is an example EUR GBP
Was there a reversal on the 27th? Yes it was! Next date is the 12th and it will be a global trend change - and before that the retracements and divergences - that's what I was wrong.
That's what I was wrong - I made a wrong forecasting method - waiting every 2nd day for high or low - even though it works -
These are the pivot points - for EUR USD also can be useful if 27 was a reversal -
If we follow the pattern there will be a reversal on 12.06, I don't even know in which direction as by this logic - the top may be low - and fly further in the trend of 500 pips
Let's continue the research - everything is fine on the history - I wish it would be like this in the future
I chose this pair as the most liquid - pullbacks, breakdowns - reversals - but this week and last week surprised me - it's all news - with them the market is inflated and artificial rather than natural -
Tantrik:
Думаю - евро\фунт исскуственная пара (может там хеджируют позиции или ещё что). Есть ТА евры и фунта отсюда можно и еврофунт высчитать. Тут не Ганн не работает, а пара выбрана не та (без закономерностей). Лучше всех будет работать на австралийце(там золото) ещё лучше на золоте. (вся мистика на золоте. Луна, яма, клад:))
Long cycle table and divergence table, in yellow for EUR USD
This is closer to the real market than the 2-day cycles
The strange thing is that the date 05.05 and going low was on the 21st
And it went from low to low on the 29th and then went into a buy cycle)
PS / logically the pair goes in buy half a month - and half a month in low - while doing divisions on the way - great -
The bottom line is that every 2 days there is a divergence (short term fall or rise) when there is a move from the green to the red zone and we see the biggest moves of 200 pips
These zones are the trends - and the main trends
I got 13.06 if you add a day for inertia, a flat, then everything is correct. (The trend will also show the date - with a vertical line)
relax ... (they give you a week or a month ahead - chop dough with your eyes squeezed shut)
If I had taken it into account - and not the old method of high or low every 2 days, the EUR GBP could have taken 250 pips from the start on the 27th bye - to hold till the 10th, it would have been a fairy tale
Every day I make new openings, in fact we traded on divergences against the trend - and now on trend and divergences - well, just great )))))) on the history before the zone change there is a flat and high liquidity - now it means until 12 in buy EUR or flat until that number - after that only in SELL why I only now know it? - maybe this forum has inspired me
And most importantly - it's in harmony with the moon phase ! dates and cycles - half a month there and half a month back - continue the test