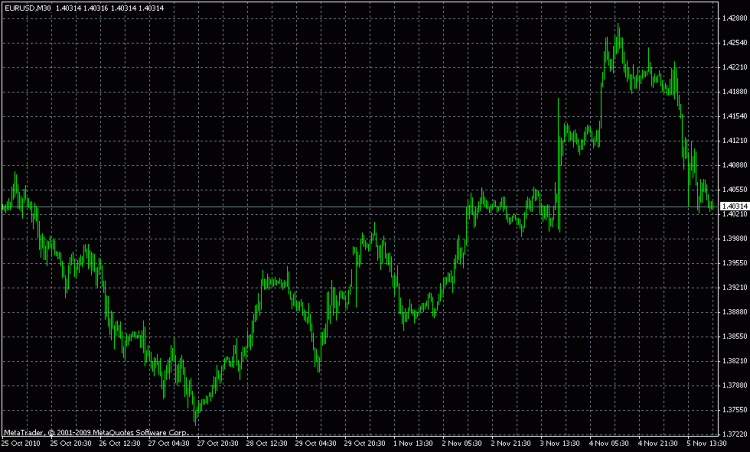
Shall we calculate?
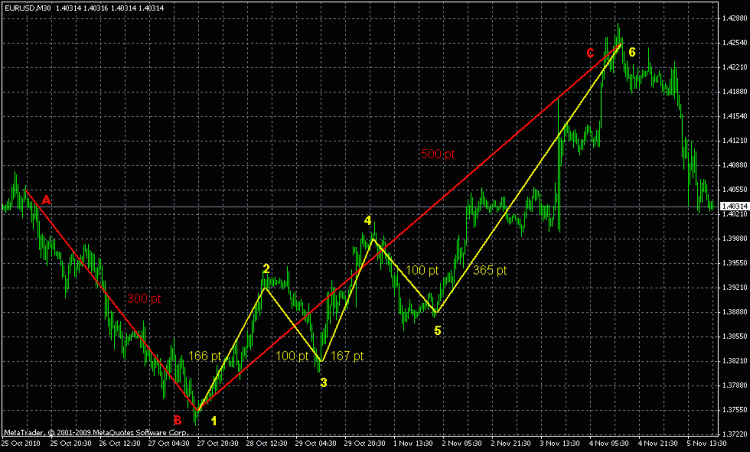
Total with occurring lots: 1,698 pips.
Your move, colleague.
The yellow line is a 15 min trend trade,
Red line - trade with the trend on H1, to increase the profitability of the red one, after each successive low, buy a buy lot and close it with a profitable stop!
nice screen - "basically every trader's dream".
Everything is nice and clear with profit, but what about the loss? i.e. the red line is not a profit but a loss - the long-term forecast was wrong?
i have to use the zigzag calculator
do plz make a screen with numbers of zigzag breaks, then you can mathematically calculate (I think the correct way to number the breaks of the zigzag - one TS with letters, and the other TS with numbers)
nice screen - "basically every trader's dream".
Everything is nice and clear with profit, but what about the loss? i.e. the red line is not a profit but a loss - the long-term forecast was wrong?
i have to use the zigzag calculator
If you need a screen with numbers of zigzag breaks, then you can mathematically calculate
The losses will be symmetrical.
The dispute is different - VladislavVG wanted to prove that the same result can be achieved on netting.
I didn't understand about the zigzag - I drew it by hand.
I didn't understand about the zigzag - I drew with my hands.
Well, it looks like a zigzag - to mark the tops
I thought we agreed that you calculate it yourself. Go on, describe the sequence of deals in detail, so that there is no confusion - for the sake of uniqueness. I mean: from such a level by which lot in which direction. For locals.
In order to be more useful, try to calculate in net terms, as you have imagined.
Do not think that you are moralizing. Let's see the result.
I can do it myself - no problem. Just a little later - now I run away on household chores.
Good luck.
Opposite positions are an advantage if the TS tracks separately sells and baisers. If this is not the case and there is averaging, then of course there is no difference.
Two different TS work on the same account.
The TCs are independent of each other.
Two different TS work on the same account.
The TS are independent of each other.
- Free trading apps
- Over 8,000 signals for copying
- Economic news for exploring financial markets
You agree to website policy and terms of use


The red one is TS #1, the yellow one is TS #2.
Each TS is reversible.
Shall we calculate?
Total with occurring lots: 1,698 pips.
Your move, colleague.