Breaking through the morning flat - which pairs? - page 10
You are missing trading opportunities:
- Free trading apps
- Over 8,000 signals for copying
- Economic news for exploring financial markets
Registration
Log in
You agree to website policy and terms of use
If you do not have an account, please register
This strategy already took place under the name LondonForexRush, I even wrote an Expert Advisor to study this strategy, but as I remember the results were not very encouraging. The description of the strategy is in the attached file, but it is clear. One indicator defines the channel of nighttime flat, the second one defines the direction of movement further breakthrough.
Такая стратегия уже имела место правда под названием LondonForexRush, я даже написал советник для исследования этой стратегии правда как мне помнится результаты были не очень обнадеживающие. Описание стратегии во вложенном файле правда на анг. яз. ну впринципе и так понятно. Один индикатор определяет канал ночного флета второй направление движения дальше пробой.
Can you suggest (or someone) a link to a russified version of this opus?
Can you suggest (or someone) a link to a russified version of this opus?
You know I had a translation somewhere, but I can't find it, there's only the strategy itself with indicators and template, but its work I'm not satisfied. Maybe you can write an Expert Advisor, and look at statistics?
Вы знаете у меня где то был перевод но я его что то не могу найти, есть только сама стратегия с индикаторами и шаблоном, но ее работа меня не удовлетворила. Может Вы напишите советник, да посмотрим статистику?
I agree. Let's give it a try. But a description of the strategy is still needed. Put the indicators somewhere.
I agree. Let's give it a try. But a description of the strategy is still needed. Throw the indicators somewhere.
Now I'm finishing my EA, so I don't have to do the same job twice.
I wrote an Expert Advisor that works intermittently, here are the indicators and the template on the picture of the tester - these indicators do not want to be displayed. Or rather, the indicator is displayed but does not give trade data. It has to do with time. This indicator has automated trading but orders are not placed. The trend indicator is bad, it lags much. Perhaps, it would be more appropriate to place orders on both sides of the channel.
The description of the strategy is simple enough. draw channel night flats before the London session. further, if there is a trend to open in the direction of the trend on the order at 5 points from the max High or Low Asian session, set a goal for ATR stop conservative to the width of the channel aggressive to the half channel. The trend is defined by the MA. But we are only trading crosses GBPXXX H1.
Here is a preview of the 2009-2010 test without optimization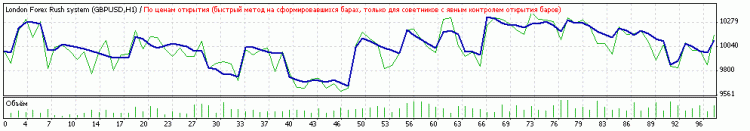
Surprisingly even came out with a profit
3
And this one with an aggressive stop, i.e. half a channel
Whatever stop you take
but the total loss is almost equal to the total profit and 97 trades for the year
0.4 per day or 7 per month I think there are more morning flotshes in a year
i.e. 12*20=480 i.e. a break in the morning flat is 480 trades per year
average profit 137.20*480/2 = 32928
average loss 68.38*480/2= 16411
This is how an EA should work out the year with this strategy taking into account the 50/50 winning ratio.