I don't know how to explain ...... it should be (i.e. it's preferable). In manual trading I use it as a filter ...... if the price touches a level and there is no diverter, I have to wait for .... and when it appears then I enter the market ..... it works fine when the price goes up 3-4 candles to sell (or released to buy), to buy these levels are reversed (100% from below and 0% from above).A divergence should appear when it reaches this level + up to 10% of crossing this level (if the price has gone through for example 80% of a point counting from zero to one hundred where levels like Fibo are placed) .... Maqd should be set as slow EMA 8 fast 5 EMA and MACD SMA 3
 point 100
odiseif,
Here's a question for you. Suppose the Expert Advisor has been written using this system. So, the price goes up and reaches the required level, the divergence is correct. We make an entry downwards, but the price, how should I put it... ...doesn't go down. What to do? In the absence of a stop loss we are guaranteed to lose 100% of our deposit.
odiseif,
Вопрос на засыпку. Допустим, написали таки советник по этой системе. Итак, пусть цена идет вверх, достигла нужного уровня, образовалась дивергенция -все как надо. Делаем вход вниз, но цена, как бы это сказать... не пошла вниз. Че делать-то? В отсутствии стопа нам гарантирован слив 100% депо.
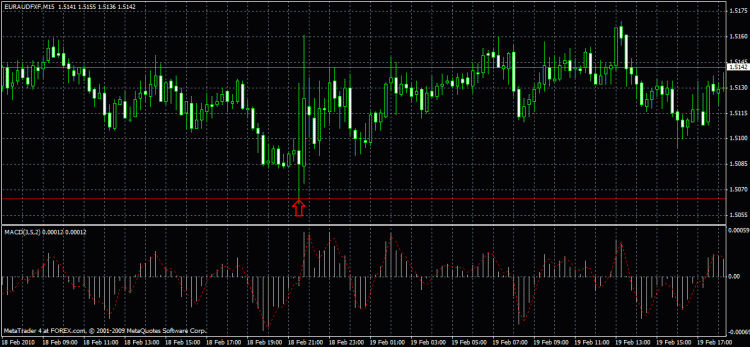
i need the system ...and then you can adapt it to your needs .... but.... there is a logic that says whether the price goes back or not ..... i can't tell the exact percentage but that's not the point .... the problem is when you reach this level they might jump because it's a critical level ...But the price is being pulled back like a bull by the horns .... it is pulling to a correction, so sooner or later it will return to this line and go a bit lower .... price usually goes higher when in the past history are similar levels and the price reaches that level, because it is more important .... say we work on the daily chart .... and previously also had built Fibo levels .....i.e. if we are at 161.8 level and not too far from it there is 61.8 % of more important level, price naturally follows that level ...i don't place stops loss .....the longest i have gone through is 200 pips .... but price eventually returned.....the hardest to go through is before the reversal .....up to the reversal now on eurAud.In fact, there should be a reversal, because now the price is at very important levels and they are pulling it ... shoot down stops .... let the price spook ..... but I can safely say that this pair will start to rise ..... here is a screenshot and a trade opened in the shadow of the candle ..... look at the shadow of the candle when I bought .... price in 15 minutes went almost pips back .... I just managed to close this 45 pips ..... but that is not the point .... important level when I bought .....
| 11827383 | 2010.02.18 21:37 | buy | 0.01 | euraudfxf | 1.5075 | 0.0000 | 1.5175 | 2010.02.18 21:58 | 1.5121 | 0.00 | 0.00 | 0.00 | 4.11 |
If you can't explain, then what do you want to program?
You don't need to be a mathematician. give a normal definition of your diver and you will get it done.
You build it on the screen somehow, what is your principle? (don't draw it, just describe it verbally.)
Если вы объяснить не можете, что вы тогда программировать хотите?
математиком тут быть не надо. дайте нормальное определение вашего дивера и вам его сделают.
Вы же его как то строите у себя на экране, по какому принципу? (только рисовать не надо. опишите словесно)
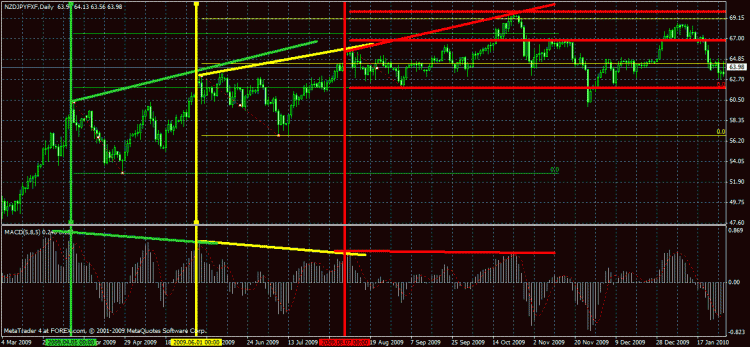
Yeah .....There's another way to trade on diverts but the problem is we don't know where the price will stop and possible reversal. That's why I invented these levels ....to find out the level of possible reversal of the trend in the opposite direction ..... Divergence (convergence) is an additional tool in this TS to filter out false levels, regardless of whether it's resistance or support.....you ask me how I built it .... in the picture clearly visible: for example the price goes up and then comes down and the histogram draws the polygon; then the price rises above the last level after correction, but the MAKD histogram draws a lower polygon than the last one ..... then the price goes up and MAKD does not see the trend strength and does not draw a higher polygon ...... that's all ..... how else can I explain you?
- Free trading apps
- Over 8,000 signals for copying
- Economic news for exploring financial markets
You agree to website policy and terms of use
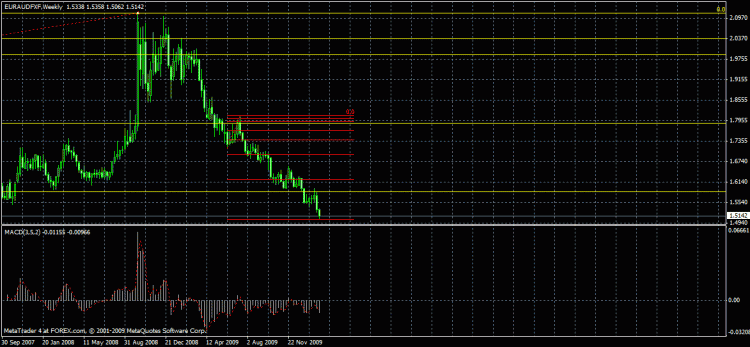
TS based on the remake levels and Fibo MACD .... The idea is this: minimum time frame 4h. Bot must itself vytstroitsy fibo levels (though from fibo was only the idea, and the levels are quite different).Buy order should be made when the price is touching this level and the MAKD detected a divergence (convergence) ... If the price touched the level and there was no divergence, you need to wait for a divergence at approximately 0-10% above (if prices go up), (below (if prices go down)) this level ..... Here are screens to see how it should look like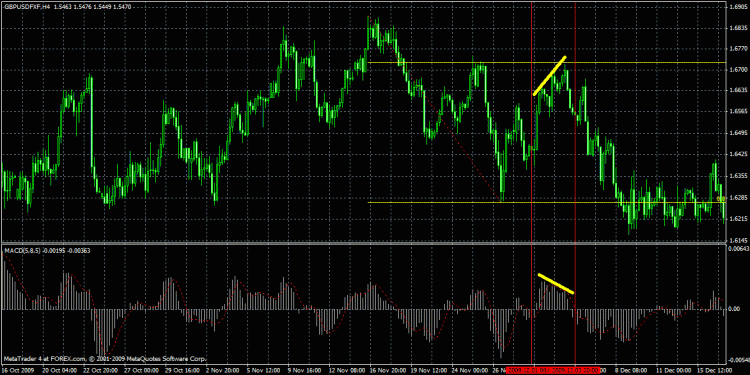
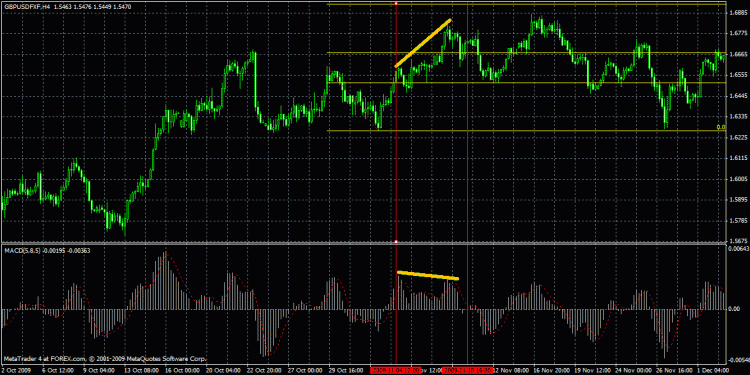
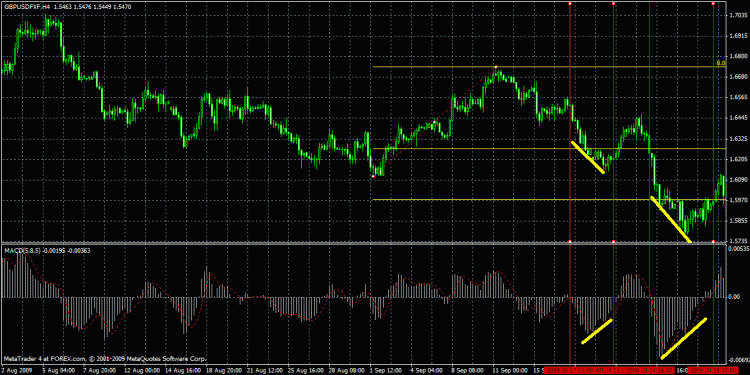
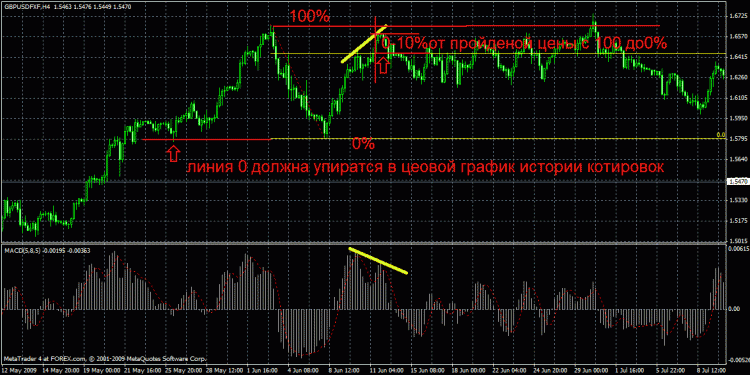
To close the trade must bwhen the moving MACD sorprickosatsya zero (or you can try to close the order based on the MACD at one timeframe below in the presence of a divergence in the opposite direction)
lot size should be based on 15% of the deposit .... stop loss is not needed ...take profit and trails are not needed