Explain about Fibonacci...
You are trying to involve logic in making sense of a subject that is not based on anything logical. That is the problem!
If you do a certain amount of work on the statistics about the work of Ф levels, it becomes clear that the Ф levels do not differ statistically significant from any other breakdown in the market, for example 1.1, 1.11, 1.111, etc. and, therefore, there is no difference how to build the F levels - from the top or bottom of the chart - the result is the same!
You are trying to involve logic in making sense of a subject that is not based on anything logical. That's the problem!
I've noticed this with myself - to make the simple into the complex. :-)
If you carry out a certain amount of work on the statistics about the work of Ф levels, then it becomes clear that in the market the Ф levels do not differ statistically significant from any other breakdown, for example 1.1, 1.11, 1.111 etc. and consequently, it does not matter how to build a breakdown of Ф - from the top or bottom of the chart - the result is the same!
Ok, but what is the practical use of correction levels? The thing is that I did not find any information about it on the net.
Here is, say, a daily chart of GBP/JPY. I draw Fibo levels of the last bullish trend and then ... but then nothing, because I do not know the essence of it, and therefore I cannot use it...
I am very grateful for any information.
NikT_58, thank you too, but that's what I'm trying to understand at the moment.
I don't want to get into demagoguery. Not the best of things - just an example that not everything is accidental, which it seems to be
I don't want to get into demagoguery. Not the best of things - just an example that not everything is accidental, which it seems to be
Thank you very much. But how can I know when to draw Fibo? In your drawings they are based on the biggest trends, but can I draw by, say, the latest trend though it is a small one? Which was formed during last 15-20 days (like on my sketch)?
- Free trading apps
- Over 8,000 signals for copying
- Economic news for exploring financial markets
You agree to website policy and terms of use
I have found some literature on Fibonacci (as applied to Forex), but I haven't found anything about Fibonacci Correction Levels. There are some scattered extracts on web-sites that contradict each other.

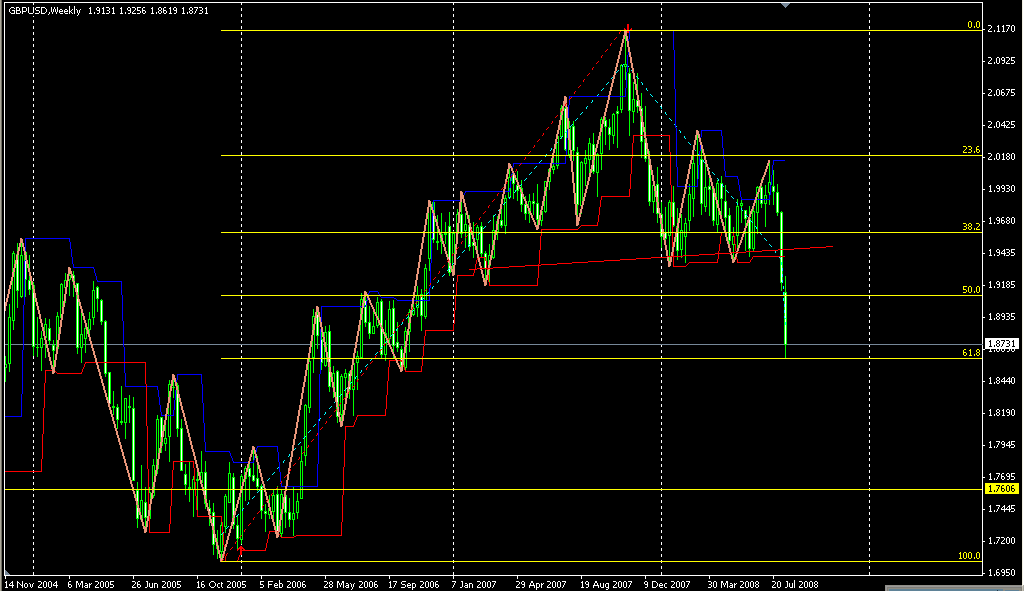
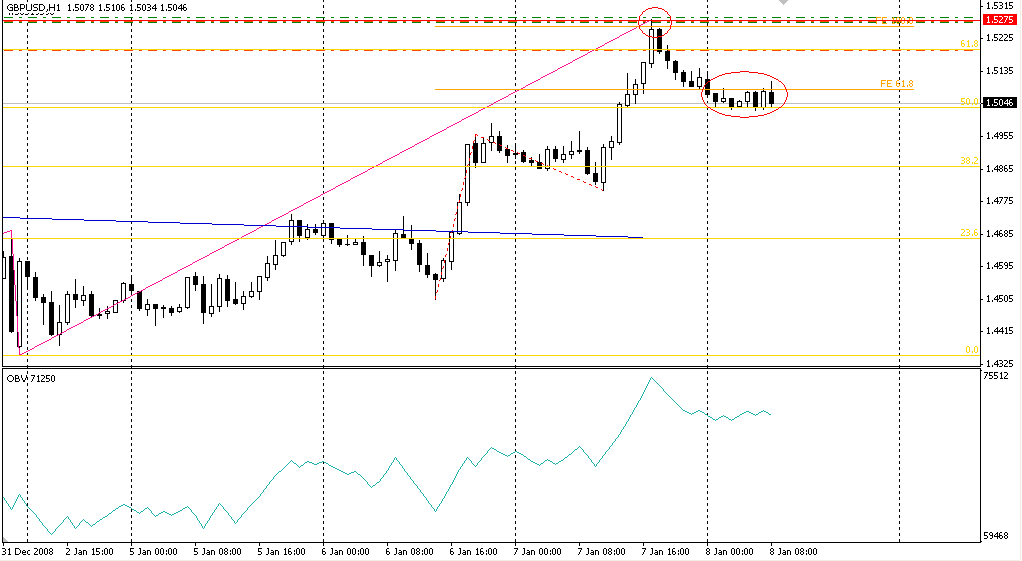
For example here levels are drawn from the bottom upwards starting at 0 at the bottom and going to 100 at the top
But here it's vice versa - 0 at the top and 100 at the bottom, although the trend is also ascending
I'm not even speaking about the description and methodology of use - everything is at the level of "from the commonplace erudition ...".
Fibonacci Time Zones
It all seems to be elementary simple - draw the trend line up/down and then examine regularities in the segments 1, 2, 3, 5, 8, 13, 21, 34 that show possible price changes. But it is not clear here, because, say, in Fisher's books there is nothing about the application of such a pattern (1, 2, 3, 5, 8, 13, 21, 34) to the charts. They (Fisher's books) speak about three correlations - 0.618, 1.000, 1.618, and are based not on the trend (from trough to peak and vice versa), but on peak-peak and trough-trough.
Does anybody know where exactly one can learn about correction levels and time Zones? And is it even necessary?