You are missing trading opportunities:
- Free trading apps
- Over 8,000 signals for copying
- Economic news for exploring financial markets
Registration
Log in
You agree to website policy and terms of use
If you do not have an account, please register
Here, last time it was July 27 - here is the Calendar tab in Metatrader 5:
2016-07-27 18:00 GMT (or at 21:00 MetaQuotes server time) | [USD - Federal Funds Rate]
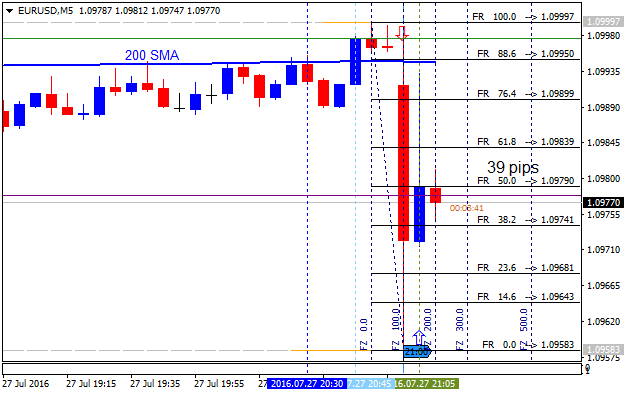
And this is how the price was moving back then:

Most likely this is an indicator based on the author's methodology, the principle of determining probability, I understand, is based on the "inverse" methodology. In a classical case traders try to determine the direction of price movement on the basis of results of decisions of FRS (or other similar structures), and the author's methodology is based on the reverse principle, i.e. the probability of an event (in this case - increase of FRS rate) depends on the location of prices and movement directions of certain instruments.
An interesting approach if you ask me.
What's the point of guessing the direction? You won't guess anyway. Usually on such news, the price moves in one direction first, and then crawls for a day or two or three in the other. You are not going to enter with a lot for the whole cut, are you?
Or maybe nothing will happen at all, they expect the same 0.5%.
Last time I took movements in both directions with the whole deposit.
It was clear from the volume that purchases were well cut by sales and vice versa.
For example, I would not get 39 pips if I traded the last news, which was on July 27 (and which we will have today).
Yes, I would open a sell, but it would be a pending sell stop order somewhere just below 1.0989 (that is, at 1.0980 for example). Simply, if it is below 200 SMA (indicator Moving Average; method: Simple; period: 200; shift: 0; Apply to: Close) - it would be a confirmation on all Sell signals, and it would be a Sell... but the profit would be small, or if at the end of the day - moose.
Because the low of the day was somewhere around 1.0958. That is, if a pending sell was opened at 1.0980, I would be able to gain 20 pips on this spike, but only if I actively and quickly move stop-loss (trailing stop).
And if at the end of the day (as many people in the West calculate, for example dailyfx.com), then the standard 70 or 100 four-digit pip (because the high of the day is 1.1064) would have been a moose.
The way you wrote it, it doesn't mean anything... You can't trade on it or study technical analysis:
Forum on trading, automated trading systems and testing trading strategies
FOMC
GS10, 2016.09.21 10:47
Fundamental levels Buy 1.1137-1.1438If it's a signal by an EA, it's better to the paid services (you can make money there).
-----------
I remember on one English forum there was (and still is!) a thread where a joser posted just numbers, for example:
1.1110
1.0964
1.1228
1.1290
And so on for ten thousand sheets. Somewhere on the three thousand-sheet he was asked what these are, and somewhere on the five thousand-sheet he answered that these are levels for buy and sell ...
:)
Where do the volumes come from? Or is it teak?
Teak, I can send you some if you need it.
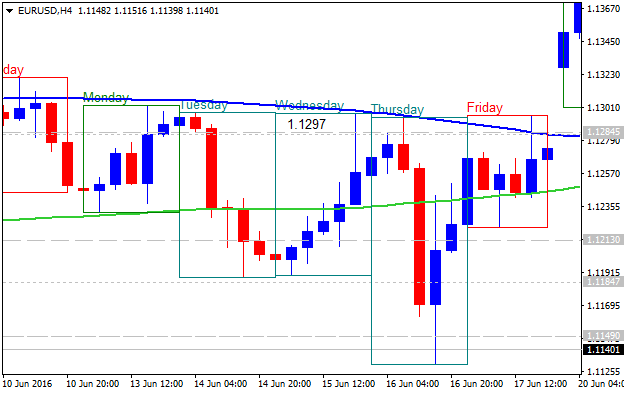
There was also the same news on June 15, and also not more than 40 pips of price movement, though, also in one direction.
But the buy stop order would have been placed at 1.1280, and it was also a spike, i.e. the close price was 1.1297, which is 17 points if you look at the chart or quick trailing stop for getting at least some points in profit (and not the fact that it would be profitable ... Spread + possible trading interruption on news spikes ...).

And this is what the situation was like on 27 April (same news as today):
And 1.1360 is the high of that day, which means it is also a spike.
And 1.1271 is the low of that day.
So, the moose is here, and if the two pending orders are in different directions, then two moose are here :)
And all this regardless of the levels.