Is martin so bad? Or do you have to know how to cook it? - page 42
You are missing trading opportunities:
- Free trading apps
- Over 8,000 signals for copying
- Economic news for exploring financial markets
Registration
Log in
You agree to website policy and terms of use
If you do not have an account, please register
Something like that:
Blue is an annual trend system with standard lot, period runs from 1 to 1000, and crimson is the same system but with martin, as you can see the surface is extremely unpredictable in all degrees of freedom. That is, a reasonable person will not rely on such extreme luck, although it does not dive below zero, but it is still a great attraction...
Sorry this is still a demo version of what I wanted to see, there are a lot of comments, but overall it's easy to understand what it's about.
The system must have certain conditions for a Martin, a simple trend one will not do, so the analysis is beautiful but predictable.
If I have time, I will post similar interpretations with channelers, I can only say that the picture is unlikely to be very different. Because I have seen a similar picture on dozens of tests, I haven't done a hundred yet. It's simple, if the channel is set up in such a way that it has a profit in tests and is robust in some degrees of freedom, with a standard lot, then the martin will be noisy when running in a range of some parameter from which the density of orders of a strategy depends on.
The conclusion is as follows: you can work with the martin only in retrospect and adjust its settings so that it would give you advantages compared to other MM on some combination of parameters, but it is not reasonable to expect repetition in the accuracy of history and stability of the system when slightly changing values of the parameters. The equity fluctuates very strongly.
If I have time, I will post similar interpretations with channelers, I can only say that the picture is unlikely to be very different. Because I have seen a similar picture on dozens of tests, I haven't done a hundred yet. It's simple, if the channel is set up in such a way that it has a profit in tests and is robust in some degrees of freedom, with a standard lot, then the martin will be noisy when running in a range of some parameter from which the density of orders of a strategy depends on.
The conclusion is as follows: you can work with the martin only in retrospect and adjust its settings so that it would give you advantages compared to other MM on some combination of parameters, but it is not reasonable to expect repetition in the accuracy of history and stability of the system when slightly changing values of the parameters. It's very difficult to expect the equity to fluctuate.
Something like that:
Blue is the annual trend system with a standard lot, the period runs from 1 to 1000, and crimson is the same system but with a martin, as you can see the surface is very unpredictable in all degrees of freedom. That is, a reasonable person will not rely on such extreme luck, although it does not dive below zero, but it is still a great attraction...
I'm sorry this is still a demo version of what I wanted to see, there are a lot of comments but overall it's easy to see what it's about.
Decent visualisation.
The classic martingale could have been left untouched. The fact that it doesn't work is obvious to everyone.
And here if to simulate TC with more serious brains using averaging in softer variants, with possibilities of overturning in the channel, then smoother pictures can turn out.
The classic martingale could have been left untouched. That it doesn't work is obvious to everyone.
Cool. That's exactly what I was suggesting to do as a standard feature in MT5. It would be very clear to see all results after optimization in this form. We already have a 3D chart in MT5. Now we only need to do a small thing. ))
I agree, it's handy to have everything you need in one piece of software.
I agree the picture won't change as long as you look at it one-sidedly.
I have given my view of the situation, you can give yours. I propose to test my strategy on a yearly interval, with a linearly increasing parameter that determines the density of orders per unit time. A certain multiplier for the parameter(s).
You may tabulate 100 results for your strategy with standard lot and the same number of results with martin, I will add them to my supersoft and paste them here as a surface picture. Then we will check if it is only me who "can't cook it" or it is a general trend.
As you have probably already realised, this argument cannot be solved by words, stronger arguments will have to be used. I propose as such arguments, the results of multi-testing of different TS in combination with different MM. If there are objections, then justify what the flaw in this type of argumentation is.
But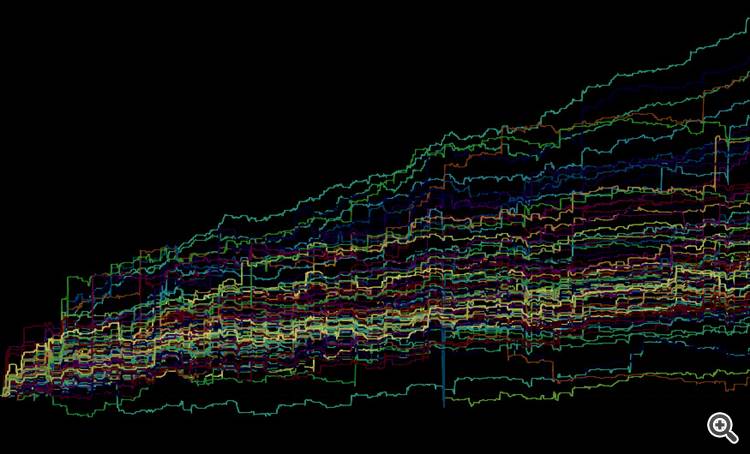
But the most interesting thing is the other thing! If we take such results of testing the system and average 100 equity curves obtained with a constant lot and then do the same for all 100 curves where martingale was used, they will be almost identical, the only difference is the scaling factor! That's how it would be if we diversified trading by strategy parameter. So it turns out that marting does nothing at all but destabilise.
A decent visualisation.
The classic martingale could have been left untouched. The fact that it doesn't work is obvious to everyone.
But if you simulate the TS with more serious brains using averaging in softer variants, with opportunities to flip in the channel, you may get smoother pictures.
What the hell kind of "serious brains", my dear? My system averages 80 pips a day. And as you can see from the picture, it is almost perfect. It's a pure exponent with reinvestment.
I will especially give you a steep channel and prove that it is much more stable without martin.
I have provided my view of the situation, you can provide your own. I propose to test my strategy on a yearly interval, with a linearly increasing parameter on which the density of orders per unit time depends. A certain multiplier for the parameter(s).
You may tabulate 100 results for your strategy with standard lot and the same number of results with martin, I'll add them to my supersoft and paste them here as a surface picture. Then we will check if it is only me who "can't cook it" or it is a general trend.
As you have probably already realised, this argument cannot be solved by words, stronger arguments will have to be used. I propose as such arguments, the results of multi-testing of different TS in combination with different MM. If there are objections, then justify what the flaw in this type of argumentation is.
But
But the most interesting thing is the other thing! If we take such results of testing the system and average 100 equity curves obtained with a constant lot and then do the same for all 100 curves where martingale was used, they will be almost identical, the only difference is the scaling factor! That's how it would be if we diversified trading by strategy parameter. It turns out that marting does nothing but destabilise.
Page 25. But I wouldn't be able to say that this case fulfils all the requirements of the task, unfortunately it doesn't. In general your study would be correct if it also fulfilled all the rules. This can be seen from your graph itself.
Not quite sure what to look for on page 25. Please repeat the requirements, I didn't find them there. I need at least 10, preferably 100 for constant lot and 100 for martin. The task is to check the usefulness of martin. What it adds or subtracts to a representative statistical sample. 1 curve is not a statistic.
Attached is an example with 10 equities, two variants(txt csv) as an example. I can download all 100 but the file is more than 800 meters (uncompressed), after all it is more than 50 mio digits in the table 525600x100 Even open it is not fast.
The aim is to estimate "robustness" of the TP with variation of parameters, with a constant lot and martin. In order to find out what we may obtain and what we may lose, and under what conditions. I'm neutral and may change my mind, I really like to change my mind.) But I need a decent argument and proof.
Not quite sure what to look for on page 25. Please repeat the requirements, I didn't find them there. I need at least 10, preferably 100 for constant lot and 100 for martin. The task is to check the usefulness of martin. What it adds or subtracts to a representative statistical sample. 1 curve is not a statistic.
Attached is an example with 10 equities, two variants.
The purpose is to estimate "robustness" of the TS for parameter variation, with a constant lot and martin. I want to know what I am getting and what I am losing, and under what conditions. I'm neutral and glad to be converted, I actually like to be converted)))). But I need a decent argument and proof.