Hello everyone and happy new year to you friends.
I would like to raise the topic of accumulation zone or consolidation zone (whatever you want to call it).
In general, if there is any regularity, if after leaving this accumulation zone, the price continues its movement.
In general, this is one of many trading systems that I wanted to discuss. I would like to show you one screenshot that I have used in my trades.
The supposed discussion on the pairs of euro dollar, pound dollar, dollar canadian. You may present your variants.
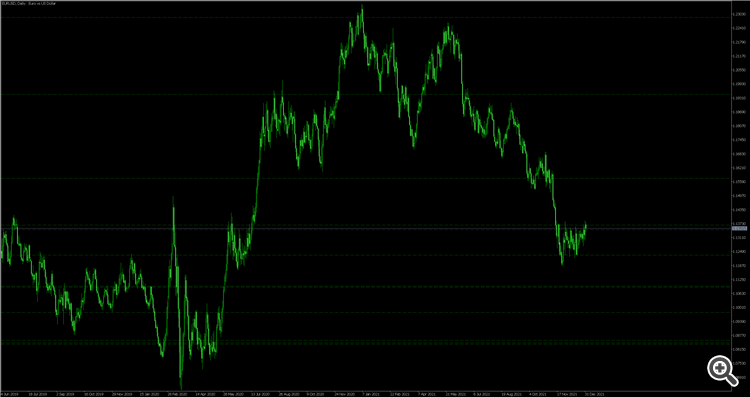
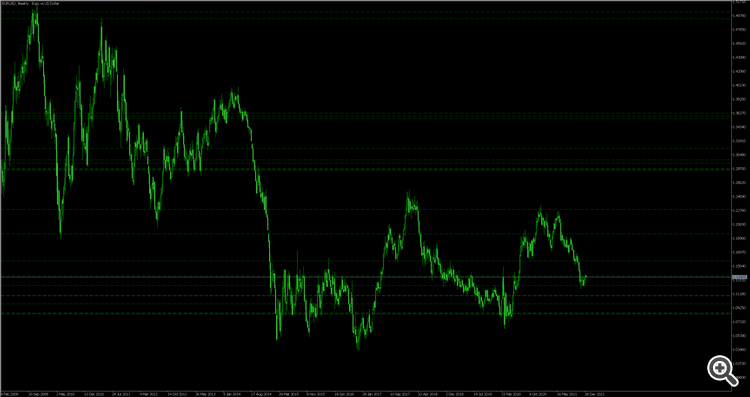
As you can see, there are certain zones(small) and there is a reaction on them.
I would like to collect statistics with your help. I hope you can help me)))
Ok, let's call them levels or zones. The meaning is the same, price has stopped at these places before changing direction or continues to the next level.
For example, the analysis of overbought and oversold levels of the RSI indicator on the timeframe H2 from 01.01.1990.
Levels displayed on the D1 timeframe
Levels displaying on the timeframe W1
Before we continue with the topic of universal levels, I wanted to understand how you define this area(accumulation zone or consolidation zone).
OK, let's call them levels or zones. The meaning is the same, price has stopped at these places before changing direction or continues to the next level.
For example, the analysis of overbought and oversold levels of the RSI indicator on the timeframe H2 from 01.01.1990.
Levels displayed on the D1 timeframe
Levels displaying on the timeframe W1
Before we continue with the topic of universal levels, I wanted to understand how you define this area(accumulation zone or consolidation zone).
First of all I look at the 4hour or daily chart where the price is and after 30m or 15m I look for an entrance point.
I do it with one of the many over the past few years.
I would like to hear your opinion.
If I understand correctly, don't look at all to see if such an area has existed historically (in the specified price range).
Everything historically has already been worked out.
Unless of course there was a crossover.
I mean, if you throw in a level from history that has been crossed once, twice or more,,,,
it's not that important anymore. You have to look at the nearest levels.
I asked myself if the RSI indicator readings form any kind of pattern that can be observed as price levels where the indicator indicates a change in trend. I think such a pattern exists, it can be clearly seen in the attached pictures above.
No Lolita, you are wrong. No indicator will tell you that the trend has changed.
- Free trading apps
- Over 8,000 signals for copying
- Economic news for exploring financial markets
You agree to website policy and terms of use


Hello all and happy new year to you friends.
In this topic I want to raise the topic of the accumulation zone or consolidation zone (whatever you want to call it).
In general, if there is any regularity, if after leaving this accumulation zone, the price continues its movement.
In general, this is one of the many trading systems I wanted to discuss. For your attention I would like to present one screenshot from which I made a deal.
Supposed to discuss the pair euro-dollar, pound-dollar, dollar-canadian. You may present your variants.
As you can see, there are certain zones(small) and there is a reaction on them.
I would like to collect statistics with your help. I hope you can help me)))