Fill Channel Color
However if I arranged in another sequence then the histogram could even disappear:
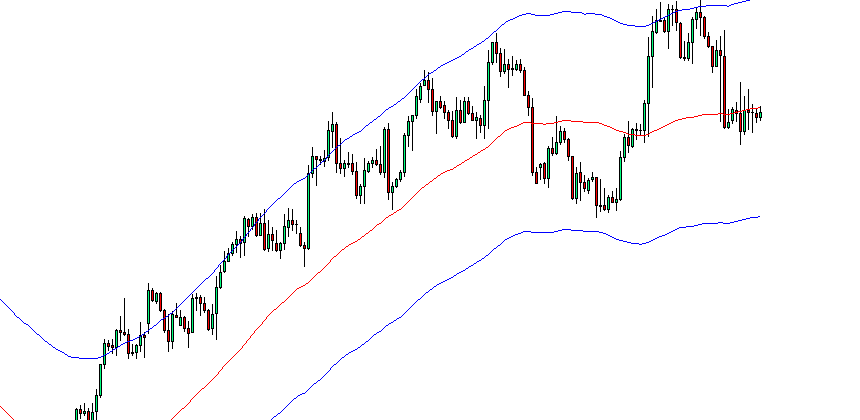
   SetIndexBuffer(0,BullishZoneBuffer); //the green zone
   SetIndexBuffer(1,BearishZoneBuffer); //the orange zone
   SetIndexBuffer(2,LowerBuffer); //the lower boundary line
   SetIndexBuffer(3,UpperBuffer);
   SetIndexBuffer(4,MABuffer);

   SetIndexStyle(0,DRAW_HISTOGRAM, STYLE_DOT);
   SetIndexStyle(1,DRAW_HISTOGRAM, STYLE_DOT);
   SetIndexStyle(2,DRAW_LINE);
   SetIndexStyle(3,DRAW_LINE);
   SetIndexStyle(4,DRAW_LINE);
I have tried look for documentation related to filling the channel but could not find any. Would appreciate if someone could explain the logic behind the property or direct me to the documentation.
Attached is the sample mq4 for anyone who are interested with the full code.
Best Regards,
Tee
Files:
pic2.png
18 kb
You are missing trading opportunities:
- Free trading apps
- Over 8,000 signals for copying
- Economic news for exploring financial markets
Registration
Log in
You agree to website policy and terms of use
If you do not have an account, please register
Hi All,
I have successfully written the code to paint the zone in between of two moving average channels with 2 different colors. However, I am still unclear about how it actually works.
For example, if the array are arranged in the following sequence, then the following chart would produce: