Draw Trend Lines
Try this code.
void drawlr(string points)
{
   string res[];
   StringSplit(points, ',', res);
   Print("res[0]", res[0]);
   Print("res[1]", res[1]);

   if(ArraySize(res) == 2)
   {
      double close_array[1];
      CopyClose(_Symbol, PERIOD_H1, 0, 1, close_array);

      datetime todays_time = iTime(NULL, PERIOD_H1, 0);
      datetime future_time = StringToTime(res[1]);
      double   today_price  = NormalizeDouble(close_array[0], _Digits);
      double   future_price = NormalizeDouble(StringToDouble(res[0]), _Digits);
      //string epoch_todays_time = todays_time;
      //string epoch_future_time = res[1];
      if (ObjectFind(0, "lightgbm_line") < 0)
         ObjectCreate(0, "lightgbm_line", OBJ_TREND, 0, todays_time, today_price, future_time, future_price);

      ObjectSetInteger(0, "lightgbm_line", OBJPROP_COLOR, clrRed);
      ObjectSetInteger(0, "lightgbm_line", OBJPROP_STYLE, STYLE_SOLID);
      ObjectSetInteger(0, "lightgbm_line", OBJPROP_WIDTH, 1);
   }
}
Try this code.
Thank you for your reply! Finally i can draw it . Can i ask you to one more question ? When i want to add one another line for the future line's next, i edit the code like this :
      double close_array[1];
      CopyClose(_Symbol, PERIOD_H1, 0, 1, close_array);

      datetime todays_time = iTime(NULL, PERIOD_H1, 0);
      double   today_price  = NormalizeDouble(close_array[0], _Digits);

      double   future_price1 = NormalizeDouble(StringToDouble(res[0]), _Digits);
      datetime future_time1 = StringToTime(res[1]);

      double   future_price2 = NormalizeDouble(StringToDouble(res[2]), _Digits);
      datetime future_time2 = StringToTime(res[3]);

      double   future_price3 = NormalizeDouble(StringToDouble(res[4]), _Digits);
      datetime future_time3 = StringToTime(res[5]);


      if (ObjectFind(0, "line1") < 0 && ObjectFind(0, "line2") < 0 && ObjectFind(0, "line3") < 0 )
         ObjectCreate(0, "line1", OBJ_TREND, 0, todays_time, today_price, future_time1, future_price1);
         ObjectCreate(0, "line2", OBJ_TREND, 0, future_time1, future_price1, future_time2, future_price2);
         ObjectCreate(0, "line3", OBJ_TREND, 0, future_time2, future_price2, future_time3, future_price3);

      ObjectSetInteger(0, "line1", OBJPROP_COLOR, clrRed);
      ObjectSetInteger(0, "line1", OBJPROP_STYLE, STYLE_SOLID);
      ObjectSetInteger(0, "line1", OBJPROP_WIDTH, 2);

      ObjectSetInteger(0, "line2", OBJPROP_COLOR, clrOrange);
      ObjectSetInteger(0, "line2", OBJPROP_STYLE, STYLE_SOLID);
      ObjectSetInteger(0, "line2", OBJPROP_WIDTH, 2);

      ObjectSetInteger(0, "line3", OBJPROP_COLOR, clrAqua);
      ObjectSetInteger(0, "line3", OBJPROP_STYLE, STYLE_SOLID);
      ObjectSetInteger(0, "line3", OBJPROP_WIDTH, 2);
However i can't see, every price and time values coming also.
Thank you for your reply! Finally i can draw it . Can i ask you to one more question ? When i want to add one another line for the future line's next, i edit the code like this :
However i can't see, every price and time values coming also.
You want to draw multiple trend lines? A screen shot description would make it easier to help.
You want to draw multiple trend lines? A screen shot description would make it easier to help.
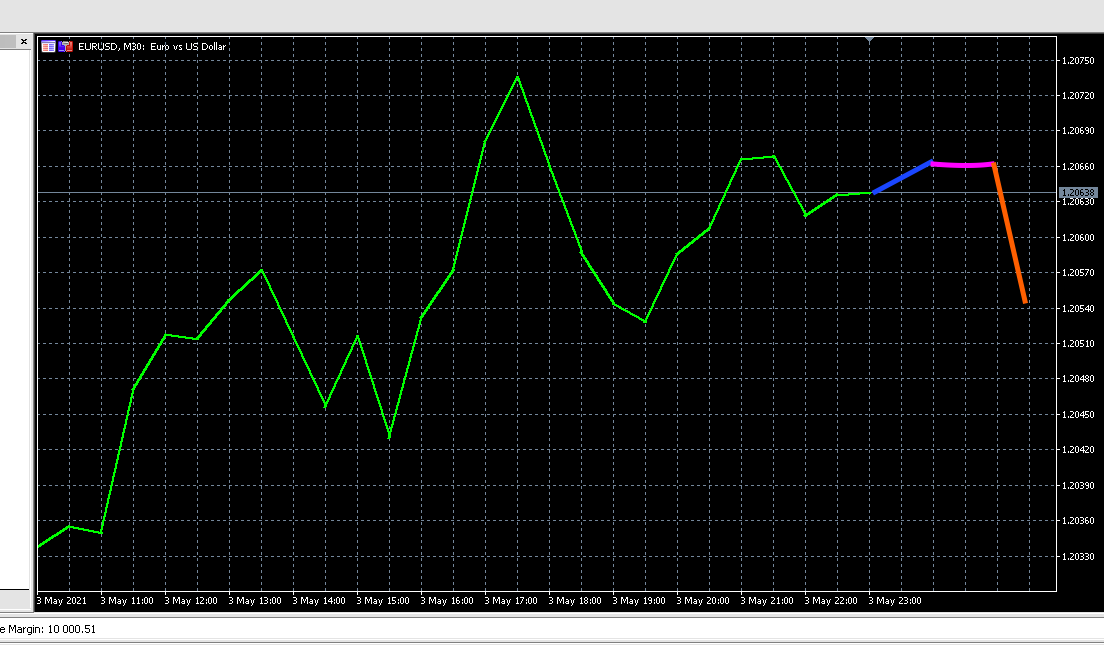
Yes, i want to draw multiple diffrent lines but for the future timestamps from now. I added the screenshot for you, i hope it can describe what i want actually.
From what I understood you want the lines to drawn there before price trades to those points.
Yes, i want to draw multiple diffrent lines but for the future timestamps from now. I added the screenshot for you, i hope it can describe what i want actually.
This should do, I tried explaining why the code, hope it helps. it could be modified to make it even small.
   double closeT, today_price;         // closeT ==> Today Close
   closeT = iClose(_Symbol, PERIOD_H1, 0);
   today_price = NormalizeDouble(closeT, _Digits);
   /*
   ---
    CopyClose (_Symbol, PERIOD_H1, 0, 1, close_array);  // Would work but you are just copying a single value (you don't need an array for a single value
   */

   datetime todays_time = iTime(_Symbol, PERIOD_H1, 0);
// Using "_Symbol" and not "NULL" cause they mean the samething, makes easier to ready I guess

   datetime Ftime1, Ftime2, Ftime3;       // Ftime ==> Future Time
   double Fprice1, Fprice2, Fprice3;      // Fprice ==> Future Price

// Using the Assumption they would all be 1H ahead of each other, your could add, 1 Hour to each to get the next
   Ftime1 = todays_time + PeriodSeconds(PERIOD_H1);
   Ftime2 = Ftime1 + PeriodSeconds(PERIOD_H1);
   Ftime3 = Ftime3 + PeriodSeconds(PERIOD_H1);

// You are entering the Future price from an input
   Fprice1 = NormalizeDouble(StringToDouble(res[0]), _Digits);
   Fprice2 = NormalizeDouble(StringToDouble(res[2]), _Digits);
   Fprice3 = NormalizeDouble(StringToDouble(res[4]), _Digits);

// Draw you Lines call the Function DrawLine, with the values requires
   DrawLine("line1", clrRed, todays_time, today_price, Ftime1, Fprice1);
   DrawLine("line2", clrOrange, Ftime1, Fprice1, Ftime2, Fprice2);
   DrawLine("line3", clrAqua, Ftime1, Fprice1, Ftime2, Fprice2);

//+------------------------------------------------------------------+
//|                   Draw the Trend Line                            |
//+------------------------------------------------------------------+
void DrawLine(string name, color Clr, datetime t1, double p1, datetime t2, double p2)
   {
      //--- Searching if the object (Line in this case) is already created in the chart, if not, create it
      if((ObjectFind(0, name) < 0))
         ObjectCreate(0, name, OBJ_TREND, 0, t1, p1, t2, p2);
      //--- Set the properties of the said object(line).
      ObjectSetInteger(0, name, OBJPROP_COLOR, Clr);
      ObjectSetInteger(0, name, OBJPROP_STYLE, STYLE_SOLID);
      ObjectSetInteger(0, name, OBJPROP_WIDTH, 2);
   }
cheers!!
From what I understood you want the lines to drawn there before price trades to those points.
This should do, I tried explaining why the code, hope it helps. it could be modified to make it even small.
cheers!!
Thank you so much !! Its really helped me to improve my advisor.
Please what does the res[0] means
The OP up top is merely using a string to mimic an array of sorts, which designates the end price of each section of the swinging trendline.
void drawlr(string points) {
 string res[];
 StringSplit(points, ',', res);
 Print("res[0]",res[0]);
 Print("res[1]",res[1]);

 ...

 }
}
- Free trading apps
- Over 8,000 signals for copying
- Economic news for exploring financial markets
You agree to website policy and terms of use
Hi everyone, i am newbie here and i search all of the issue about the trendlines and nothing dont improve my codes. When i want to draw trend line from last current close point to 1 hour later close point, just i cant see any line in chart when i import the expert advisor the chart. Every result ise come in the terminal.
Generally, input (points) is included something like "1.34434,2021-04-30 15:01:05" first one is the close point of the 1 hour later and second one is 1 hour later datetime. I must input as string this ones but how can i draw it? please help me. Thank you for all answer.