Discussion of article "Self-adapting algorithm (Part III): Abandoning optimization"
Good afternoon. I would like to share my opinion on unstable candle size. I propose to allocate a second independent direction for analysing candlestick sizes. Find the average value of candlestick size for a particular timeframe and use any deviation from this value to extract profit. And the signal to open a position should be considered as a signal by candlestick size and a signal by direction at the same time
Of course you can do it, but if you can predict the size of the candle, it means that you can predict the direction and trade options very successfully. In general, the task is worthy of the Nobel Prize, to be honest. The average will not work here, because the average candle size is approximately proportional to the root of the number of steps in this candle multiplied by the average step size. If we take an hour candle, then there are 60 minute candles and the size of an hour candle will be on average the root of 60 multiplied by the average size of a minute candle. It turns out that the number of steps in the hour candle can be calculated, but in the minute candle it is impossible. The number of steps in a minute candle is unknown, because it is not clear what to take as a step, if ticks, then we will analyse the algorithms of brokerage companies, no more. If on the stock exchange, other peculiarities appear there. Candlestick size is also a separate topic on stocks, perhaps I will write about it sometime. Of course, there are no unsolvable tasks, but... a question of resources.
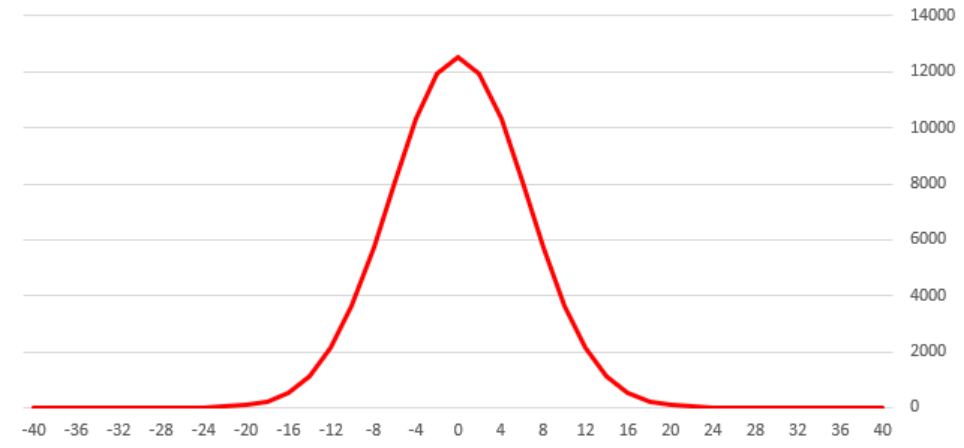
This is how the size distribution of 40 minute candles will look like. And if you find an average from this)))) it will not be the most useful value. You have to take into account the probabilities of occurrence.
And there is one more problem. As I wrote in this article, the price is not a function of time https://www.mql5.com/en/articles/8136/91748#!tab=article, so there will be additional difficulties.
There are no comments at all... You don't like it or you don't understand it or it's so clear that there's nothing to say?)
I like it, but it's a bit complicated) Parts 1-2 were clearer.
and by the way, the article https://www.mql5.com/en/articles/8136/91748#!tab=article does not open.
Remove #!tab=article from the link, it must have been attached to the wrong path
What about turning to standard indicators. Namely MA. Moving average can be built for any chart and any timeframe. It is logical that the price will cross the moving average sooner or later. Further trace the amplitude of fluctuations around the MA. And if the amplitude is greater than the average on a certain segment, then open a position in the direction of movement to the MA.
It will definitely cross the MA. But it makes no sense. For normal work, you need a theoretical model, without theory you get guessing. Here are the questions why the price should return to the average, what averaging period to take, why this period?
Standard indicators are just a set of formulas, there is no fundamental basis under them. Let's take a stochastic, RCI, MA, any of them, and try to answer the question: why should it work? If we succeed, we can start building algorithms based on them.
There are no comments at all... Don't like it or don't understand it or is it so clear that there is nothing to say?)
It's fine, I read all three articles. What I like about the approach is that everything is based on clear statistics. The articles are practical and competent.
I recently remembered an idea simple to the point of outrageousness - build zigzags on renko (on different combinations of min. zigzag length and block size), and count statistics on the distribution of lengths. Then it's roughly like yours.
I think it worked too.
There are no comments at all... Don't like it or don't understand it or is it so clear that there is nothing to say?)
The idea is not trivial and not obvious. It is not obvious to me why we open a sell immediately if there are more blocks up.
In general, it is better to elaborate on not obvious statements.
- Free trading apps
- Over 8,000 signals for copying
- Economic news for exploring financial markets
You agree to website policy and terms of use
New article Self-adapting algorithm (Part III): Abandoning optimization has been published:
It is impossible to get a truly stable algorithm if we use optimization based on historical data to select parameters. A stable algorithm should be aware of what parameters are needed when working on any trading instrument at any time. It should not forecast or guess, it should know for sure.
In the new version, I decided not to use candles because of their unstable parameters. More precisely, only M1 candles are to be used because moving on to handling ticks leads to a significant increase in resource consumption. Ideally, it is better to handle ticks.
I will analyze blocks of N points. The blocks are similar to renko but they are based on a slightly different algorithm. I have already mentioned block charts and their advantages in analysis in the article "What is a trend and is the market structure based on trend or flat".
Figure 1. Block chart
Figure 1 shows a block chart. The general view of the block chart is shown in the bottom part of the figure, while the upper image demonstrates how blocks look on the price chart. BLocks are built into the past and future from a fixed time. In the figure, the fixed time is shown as a yellow vertical line. This is a zero point, from which blocks are built into the past and future. The construction algorithm is mirrored. The fact that the blocks are built into the past and the future will be important in further development.
Blocks are needed because their main parameters are stable, controllable and, most importantly, profit/loss depends mainly on price movement in points.
Author: Maxim Romanov