Forum on trading, automated trading systems and testing trading strategies
Sergey Golubev, 2011.03.26 10:47
As I remember from the theory (which I also used in practics) - trendlines (and any support resistance lines) can be fake broken 2 times before real breakout, or just ... without breakout.
This "2 times" are written in many sources and it is well-known situation: almost everyone who is trading support/resistance or using it for some analysis - knows it. I also used this theory when trading maksigen for example.
So, to say that if the price broke trend line by next/previous candle (for the first time for examole) and because of that we can consider it as a buy or sell signal - it is totally not true/wrong.
Just practical evaluation.
Forum on trading, automated trading systems and testing trading strategies
Market Condition Evaluation based on standard indicators in Metatrader 5
Sergey Golubev, 2013.01.31 16:30
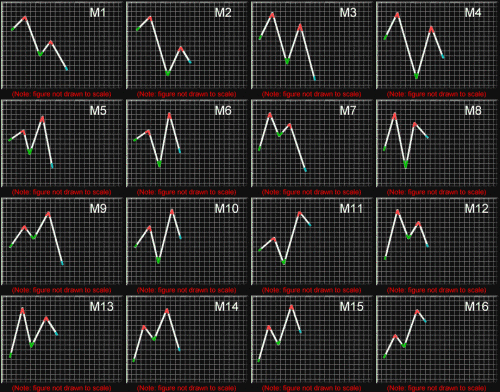
Why false breakout? Look at the image (this is Merrill's patterns for downtrend):

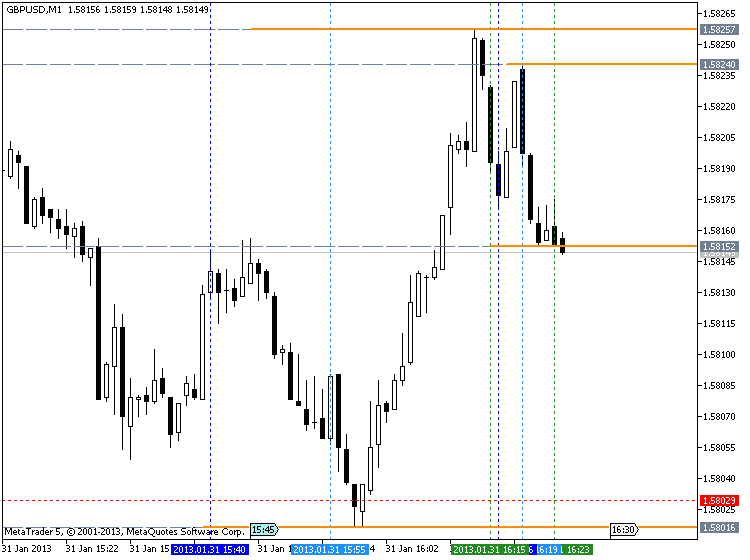
and look at GBPUSD M1 chart for now:

So, the pattern on GBPUSD chart is same as M3 Merrill, right? And the evolution of this M3 pattern was on the following way: M8 - M4 - M3. That is why it was false breakout.
Forum on trading, automated trading systems and testing trading strategies
Market Condition Evaluation based on standard indicators in Metatrader 5
Sergey Golubev, 2013.01.31 16:51
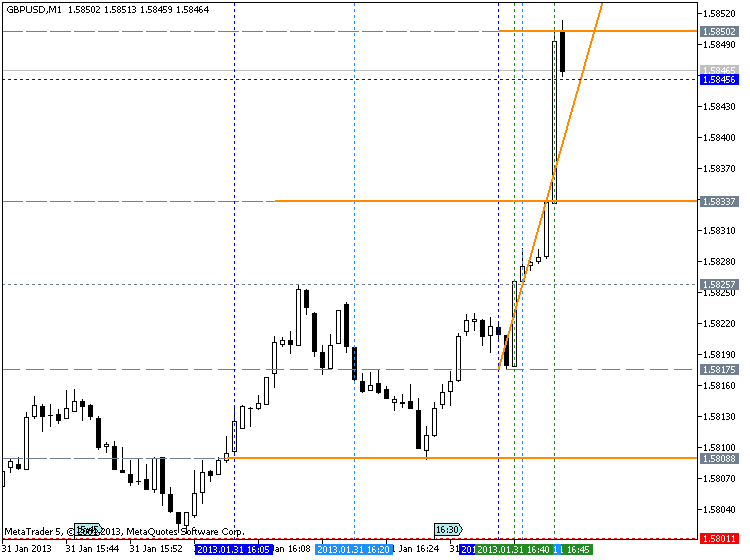
Merrill's patterns for uptrend:

and it looks like W10 with evolution as W4 - W5 - W10:

==============
Merrill patterns - the article

- Free trading apps
- Over 8,000 signals for copying
- Economic news for exploring financial markets
You agree to website policy and terms of use
Hello,
I'm trying to build a breakout trading bot with support and resistance and i want to avoid fake breakouts.
How do I go about it?