Marbo :
Hello guys,
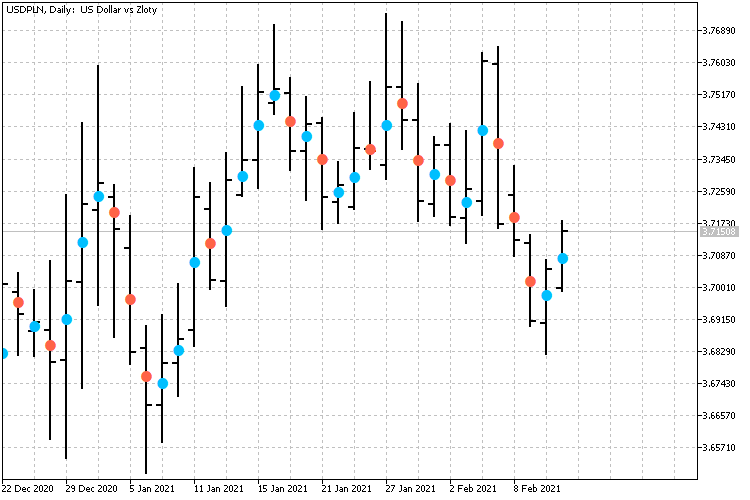
while learning MQL5 I wanted to code an indicator which prints a dot in the middle of the candle body.
A green dot if it is a bullish candle and a red dot if it is a bearish candle.
Can somebody please tell me what's wrong with my code?
What for? Why do you use iClose and iOpen functions ??? OnCalculate supplies all arrays at once:
int OnCalculate(const int rates_total,
                const int prev_calculated,
                const datetime &time[],
                const double &open[],
                const double &high[],
                const double &low[],
                const double &close[],
                const long &tick_volume[],
                const long &volume[],
                const int &spread[])
Code:
//+------------------------------------------------------------------+
//|                                                Bull Bear Dot.mq5 |
//|                        Copyright 2021, MetaQuotes Software Corp. |
//|                                             https://www.mql5.com |
//+------------------------------------------------------------------+
#property copyright "Copyright 2021, MetaQuotes Software Corp."
#property link      "https://www.mql5.com"
#property version   "1.00"
#property indicator_chart_window
#property indicator_buffers 2
#property indicator_plots   1
//--- plot Candle
#property indicator_label1  "Candle"
#property indicator_type1   DRAW_COLOR_ARROW
#property indicator_color1  clrDeepSkyBlue,clrTomato
#property indicator_style1  STYLE_SOLID
#property indicator_width1  5
//--- input parameters
input int      Input1=9;
//--- indicator buffers
double         CandleBuffer[];
double         CandleColors[];
//+------------------------------------------------------------------+
//| Custom indicator initialization function                         |
//+------------------------------------------------------------------+
int OnInit()
  {
//--- indicator buffers mapping
   SetIndexBuffer(0,CandleBuffer,INDICATOR_DATA);
   SetIndexBuffer(1,CandleColors,INDICATOR_COLOR_INDEX);
//--- setting a code from the Wingdings charset as the property of PLOT_ARROW
   PlotIndexSetInteger(0,PLOT_ARROW,159);
//---
   return(INIT_SUCCEEDED);
  }
//+------------------------------------------------------------------+
//| Custom indicator iteration function                              |
//+------------------------------------------------------------------+
int OnCalculate(const int rates_total,
                const int prev_calculated,
                const datetime &time[],
                const double &open[],
                const double &high[],
                const double &low[],
                const double &close[],
                const long &tick_volume[],
                const long &volume[],
                const int &spread[])
  {
//---
   int limit=prev_calculated-1;
   if(prev_calculated==0)
      limit=0;
   for(int i=limit; i<rates_total; i++)
     {
      CandleBuffer[i]=(open[i]+close[i])/2.0;
      if(open[i]<close[i])
         CandleColors[i]=0.0;
      else
         CandleColors[i]=1.0;
     }
//--- return value of prev_calculated for next call
   return(rates_total);
  }
//+------------------------------------------------------------------+
Result:

Files:
Bull_Bear_Dot.mq5
3 kb
Vladimir Karputov:
Code:
Result:
Thank you very much! This is very helpful for me. I also like the idea of changing colors and using only one buffer.
You are missing trading opportunities:
- Free trading apps
- Over 8,000 signals for copying
- Economic news for exploring financial markets
Registration
Log in
You agree to website policy and terms of use
If you do not have an account, please register
Hello guys,
while learning MQL5 I wanted to code an indicator which prints a dot in the middle of the candle body.
A green dot if it is a bullish candle and a red dot if it is a bearish candle.
Can somebody please tell me what's wrong with my code?