Custom Indicator is displaying UpSide down compared to original Technical Indicator


Please help me identify the error why my custom indicator is displaying upside down. Dodger Blue line is original indicator and GoldenRod color my custom indicator in the attached screen shot.

Also, I have not set LEVEL anywhere in code, yet in chart it is displayed. May be that is causing the problem!!!

  #property description "Accumulation Distribution Indicator"
//+----------------------------------------------------------------------------------------------------------+
//| Define Indicator Directives
//+----------------------------------------------------------------------------------------------------------+
  #property indicator_separate_window             // Indicator is displayed in a separate subwindow
  #property indicator_buffers 1                   // Number of required indicator buffers
  #property indicator_plots   1                   // Number of plots in the indicator
//+--------------------------------------------------------------------------------------------------------+
//| Define Indicator Calculation Array(s) and Variable(s)
//+--------------------------------------------------------------------------------------------------------+
  double    aAD[];
//+----------------------------------------------------------------------------------------------------------+
//| Custom indicator initialization function
//+----------------------------------------------------------------------------------------------------------+
int OnInit()
{
  //+--------------------------------------------------------------------------------------------------------+
  //| Functions for Indicator SubWindow properties (used instead of #property)
  //+--------------------------------------------------------------------------------------------------------+
    //--- Common Indicator Properties
    IndicatorSetString(INDICATOR_SHORTNAME,"iFx A/D");
    IndicatorSetInteger(INDICATOR_DIGITS,0);                   // Sets required accuracy of display of indicator values
  //+--------------------------------------------------------------------------------------------------------+
  //| Functions for Plotting Indicator Lables in SubWindow (used instead of #property)
  //+--------------------------------------------------------------------------------------------------------+
    PlotIndexSetString(0,PLOT_LABEL,"A/D");                  // Short name of the number N plot. It is displayed in DataWindow and in the pop-up tooltip when pointing the mouse cursor over it
    PlotIndexSetInteger(0,PLOT_DRAW_TYPE,DRAW_LINE);         // Line type for N plot
    PlotIndexSetInteger(0,PLOT_LINE_STYLE,STYLE_SOLID);      // Line style for N plot
    PlotIndexSetInteger(0,PLOT_LINE_COLOR,clrGoldenrod);     // Line color for N plot
    PlotIndexSetInteger(0,PLOT_LINE_WIDTH,1);                // Line width for N plot
    PlotIndexSetInteger(0,PLOT_DRAW_BEGIN,1);
  //+--------------------------------------------------------------------------------------------------------+
  //| SetIndexBuffer() binds a specified indicator buffer with one-dimensional dynamic array of the double type
  //+--------------------------------------------------------------------------------------------------------+
    SetIndexBuffer(0,aAD,INDICATOR_DATA);
  //+--------------------------------------------------------------------------------------------------------+
  //| ArraySetAsSeries() function after binding the array using the SetIndexBuffer() function
  //+--------------------------------------------------------------------------------------------------------+
    ArraySetAsSeries(aAD,true);
  //+--------------------------------------------------------------------------------------------------------+
  //| Indicator Array / Buffers Initialize  ... (Initialize with same Array Type data)
  //+--------------------------------------------------------------------------------------------------------+
    ArrayInitialize(aAD,EMPTY_VALUE);
//---
  return(INIT_SUCCEEDED);
}
//+----------------------------------------------------------------------------------------------------------+
//| Custom indicator iteration function
//+----------------------------------------------------------------------------------------------------------+
int OnCalculate(const int       rates_total,
                const int       prev_calculated,
                const datetime  &time[],
                const double    &open[],
                const double    &high[],
                const double    &low[],
                const double    &close[],
                const long      &tick_volume[],
                const long      &volume[],
                const int       &spread[])
{
    if(rates_total < 2)
      return(0); // Exit with Zero result
    int start_Position = (prev_calculated - 1);
    if(start_Position < 0)
      start_Position = 0;
  //+--------------------------------------------------------------------------------------------------------+
  //| Accumulation / Distribution
  //+--------------------------------------------------------------------------------------------------------+
    for(int i = start_Position; i < rates_total && !IsStopped(); i++)
    {
      double priceClose  = iClose(_Symbol,PERIOD_CURRENT,i);
      double priceHigh   = iHigh(_Symbol,PERIOD_CURRENT,i);
      double priceLow    = iLow(_Symbol,PERIOD_CURRENT,i);
      long   tickVolume  = iVolume(_Symbol,PERIOD_CURRENT,i);
      // Calculate First A/D Value
      double sumAD = ((priceClose - priceLow) - (priceHigh - priceClose));
      // Calculate Remaining A/D Values
      if((priceHigh - priceLow) == 0)
        sumAD = 0.00;
      else
        sumAD = (sumAD / (priceHigh - priceLow)) * tickVolume;
      if(i > 0)
        sumAD += aAD[i-1];
      aAD[i] = sumAD;
    }
//--- return value of prev_calculated for next call
   return(rates_total);
  }
//+----------------------------------------------------------------------------------------------------------+
Documentation on MQL5: Constants, Enumerations and Structures / Objects Constants / Web Colors
  • www.mql5.com
Web Colors - Objects Constants - Constants, Enumerations and Structures - MQL5 Reference - Reference on algorithmic/automated trading language for MetaTrader 5
Files:
ScreenShot.png  207 kb
 

This is unnecessary.

//ArraySetAsSeries(aAD,true);

This has nothing to do with the question.

for(int i = start_Position; i < rates_total && !IsStopped(); i++)
    {
      //double priceClose  = iClose(_Symbol,PERIOD_CURRENT,i);
      //double priceHigh   = iHigh(_Symbol,PERIOD_CURRENT,i);
      //double priceLow    = iLow(_Symbol,PERIOD_CURRENT,i);
      //long   tickVolume  = iVolume(_Symbol,PERIOD_CURRENT,i);
      // Calculate First A/D Value
      double sumAD = ((close[i] - low[i]) - (high[i] - close[i]));
      // Calculate Remaining A/D Values
      if((high[i] - low[i]) == 0)
        sumAD = 0.00;
      else
        sumAD = (sumAD / (high[i] - low[i])) * tick_volume[i];
      if(i > 0)
        sumAD += aAD[i-1];
      aAD[i] = sumAD;
    }

 
Nagisa Unada:

This is unnecessary.

This has nothing to do with the question.


Thanks Nagisa

removing ArraySetAsSeries ... solved the problem of upside down.

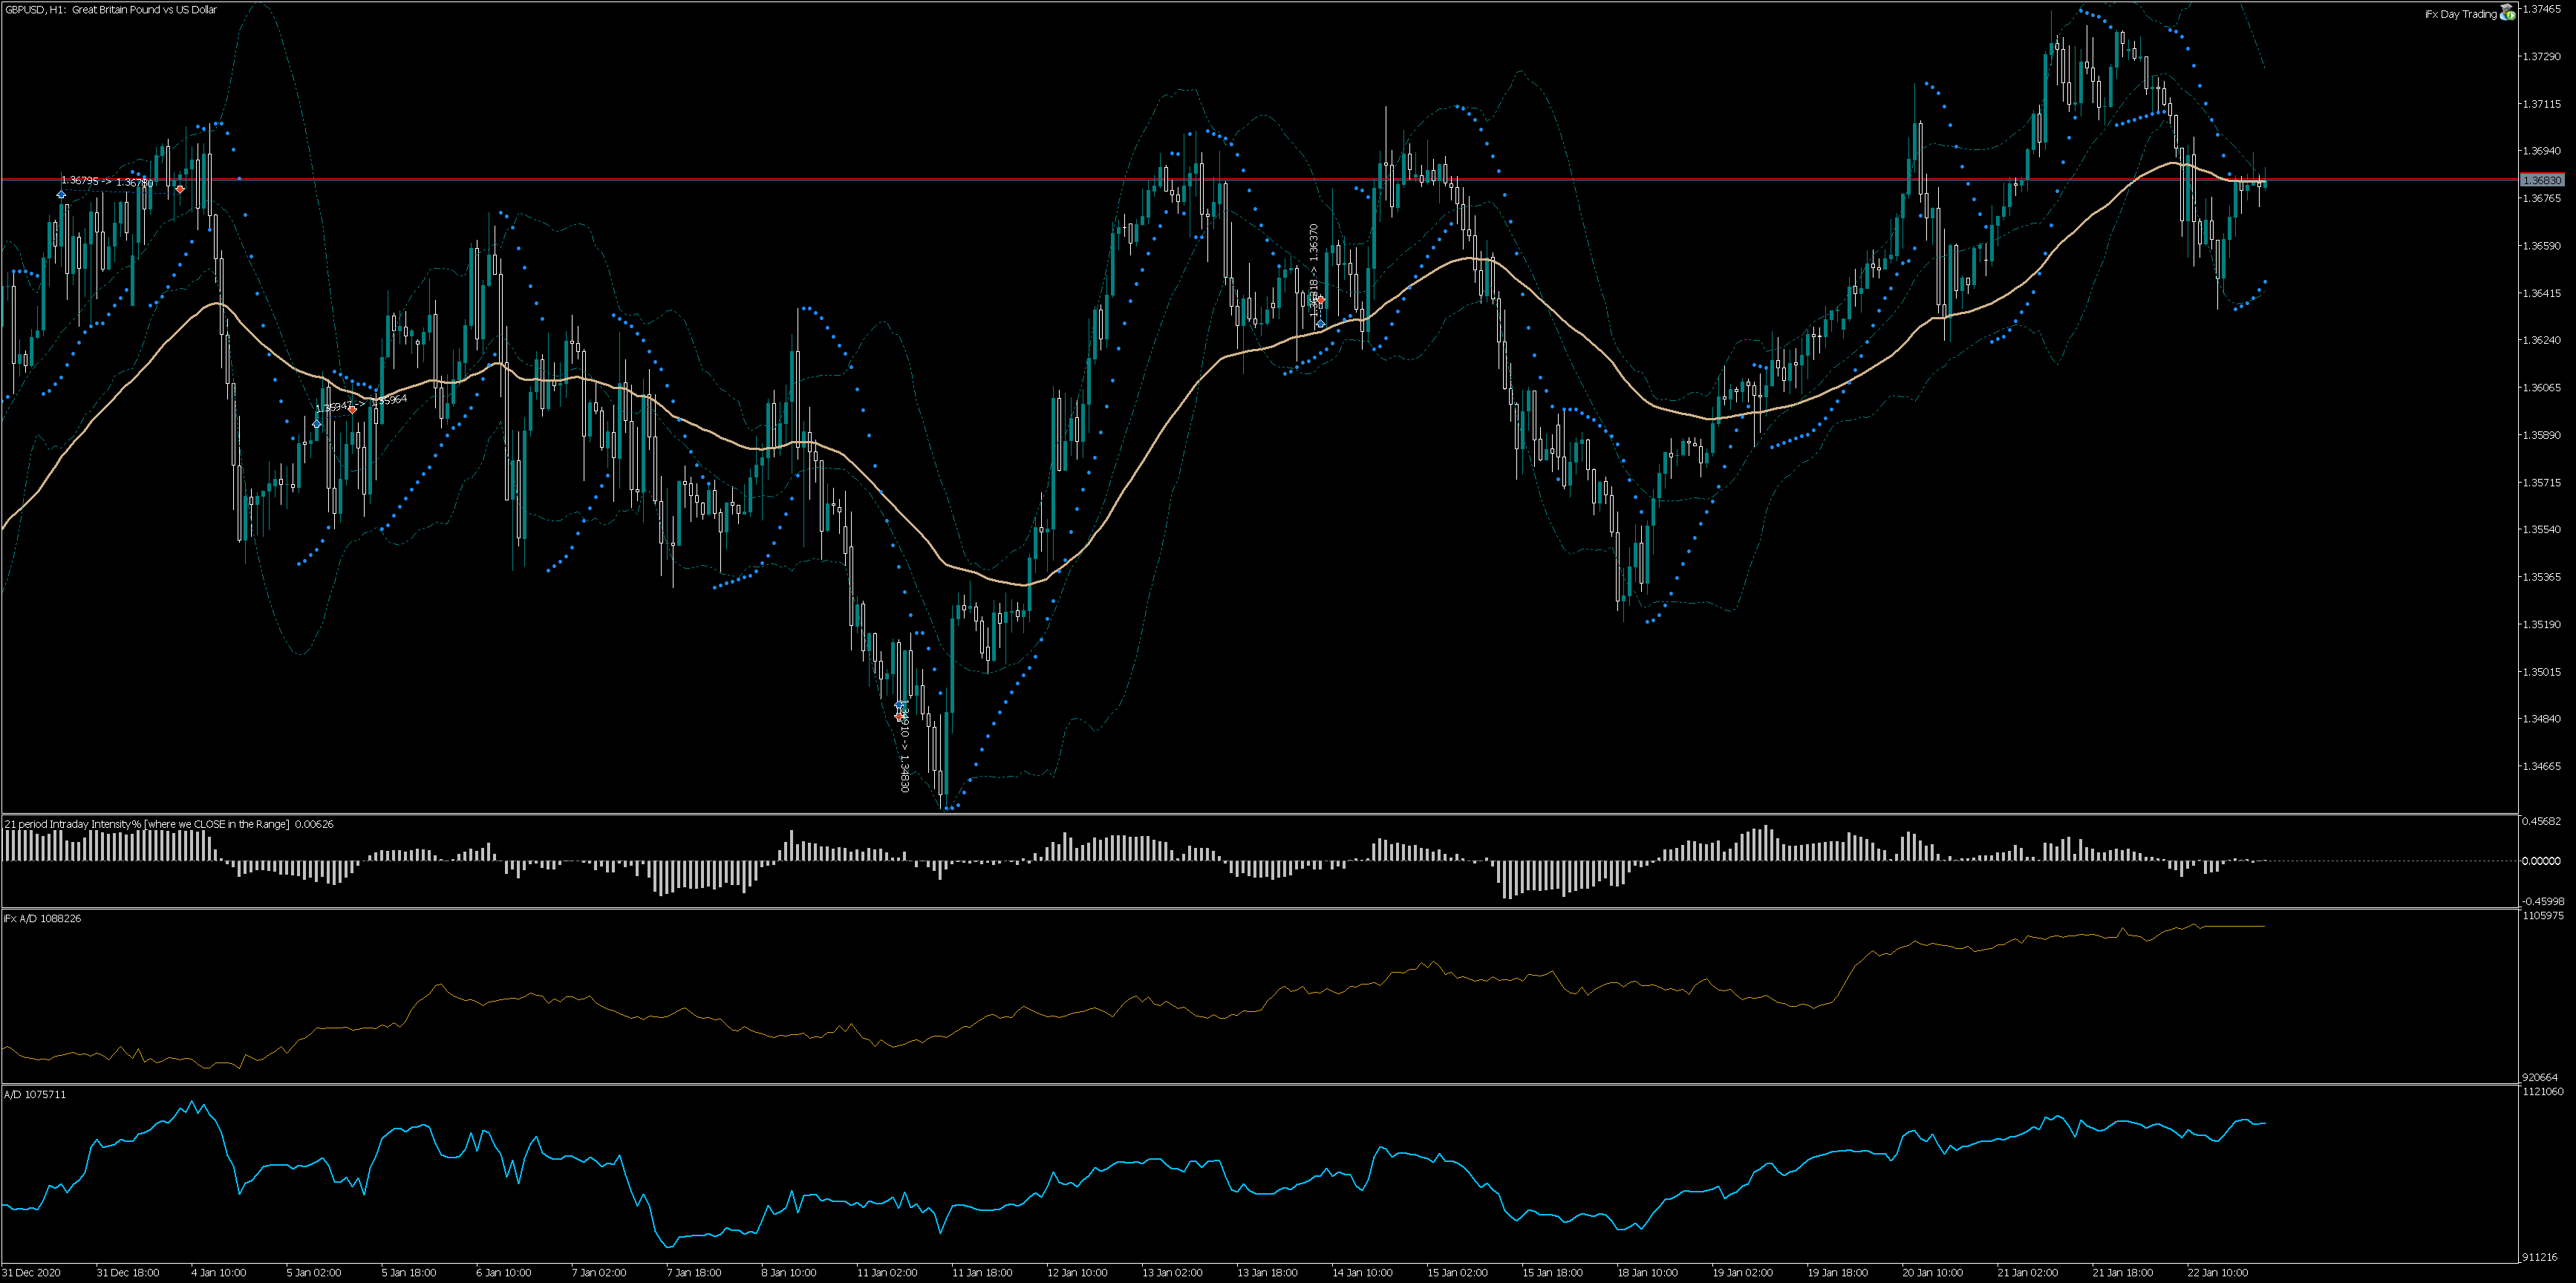
However if you notice both Dodger Blue (Technical Indicator MQL5) and GoldenRod (Custom Indicotor) are not showing consistent results!!!

The formulas for AD I took from some online indicator where the source code is available. I did not get why you have highlighted it.

My ultimate goal is to make an 10 Period Oscillator of A/D Indicator, same as the first indicator in this chart.

any suggestions would be highly appreciated.

Files:
Sample_Chart.png  201 kb
 
double priceClose  = iClose(_Symbol, PERIOD_CURRENT, i);
double priceHigh   = iHigh(_Symbol, PERIOD_CURRENT, i);
double priceLow    = iLow(_Symbol, PERIOD_CURRENT, i);
long   tickVolume  = iVolume(_Symbol, PERIOD_CURRENT, i);

If you adopt this method to retrieve prices, the order of the data will be reversed.

That is, the latest value is when "i == 0", and the oldest data is when "i == rates_total - 1".

In this case, you need to use the same method as in MT4, as follows.

ArraySetAsSeries(aAD, true);
if(rates_total < 2)
      return(0); // Exit with Zero result
   int start_Position = rates_total - prev_calculated;
   if(start_Position == rates_total)
      start_Position = rates_total - 1;
   //+--------------------------------------------------------------------------------------------------------+
   //| Accumulation / Distribution
   //+--------------------------------------------------------------------------------------------------------+
   for(int i = start_Position; i >= 0 && !IsStopped(); i--)
   {
      double priceClose  = iClose(_Symbol, PERIOD_CURRENT, i);
      double priceHigh   = iHigh(_Symbol, PERIOD_CURRENT, i);
      double priceLow    = iLow(_Symbol, PERIOD_CURRENT, i);
      long   tickVolume  = iVolume(_Symbol, PERIOD_CURRENT, i);
      // Calculate First A/D Value
      double sumAD = ((priceClose - priceLow) - (priceHigh - priceClose));
      // Calculate Remaining A/D Values
      if((priceHigh - priceLow) == 0)
         sumAD = 0.00;
      else
         sumAD = (sumAD / (priceHigh - priceLow)) * tickVolume;
      if(i < rates_total - 1)
         sumAD += aAD[i + 1];
      aAD[i] = sumAD;
   }


Nagisa Unada:

If you adopt this method to retrieve prices, the order of the data will be reversed.

That is, the latest value is when "i == 0", and the oldest data is when "i == rates_total - 1".

In this case, you need to use the same method as in MT4, as follows.


Thanks a lot Nagisa.

will look into it details and do the necessary corrections. However, I got the logic you have tried to explain.