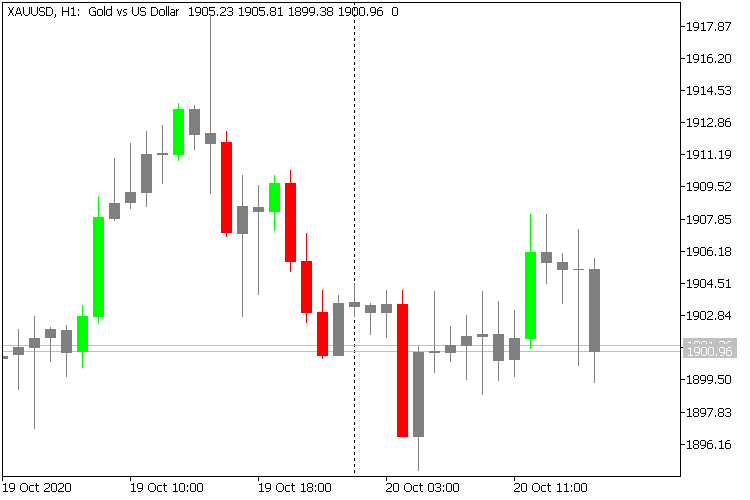
Hi! I'm trying to create a visual indicator (MT5) but I'm having difficulties (I only know the basics). I tried to modify a code available on the site, but without success (https://www.mql5.com/en/code/1349).
What I would like is:
Candle Green: Close is higher than the previous high: (C2 > H3) or (C3 > H4)
Candle Red: Close is less than the previous minimum: (C2 < L3) or (C3 < L4)
Candle Gray: No green or No red
Can someone help me? I'll appreciate a lot and pay you a coffee for your help :) Thank you!
Example:
I can't understand why there are SO MANY colors on the chart? Why are there UNCOLORED candles? Try to describe your desire more precisely and replace the colors (more precisely, indicate the name of the color from the MetaTrader palette - For example clrRed, clrGrey ...)
I can't understand why there are SO MANY colors on the chart? Why are there UNCOLORED candles? Try to describe your desire more precisely and replace the colors (more precisely, indicate the name of the color from the MetaTrader palette - For example clrRed, clrGrey ...)
Sorry for not being able to be clear. It would be something like below, so there would be no problem if the candle was completely filled, because by the difference in shades it would be possible to know if it is a bullish or bearish candle.
Assuming C1 and O1 the first candle after current 0 (to avoid repaiting):
C1,O1 = Close in the current timeframe. Ex: iClose(Symbol(),PERIOD_CURRENT,1)
H2, H3, L2, L3 = High and Low of higher timeframe. Ex: iClose(Symbol(),PERIOD_D1,2)
A) clrLimeGreen: ( (C1 > H2) or (C2 > H3) ) && (C1 > O1)
B) clrGreen: ( (C1 > H2) or (C2 > H3) ) && (C1 < O1)
C) clrRed: ( (C1 < L2) or (C2 < L3) ) && (C1 < O1)
D) clrTomato: ( (C1 < L2) or (C2 < L3) ) && (C1 > O1)
E) clrGray: ( !A and !B and !C and !D )
Sorry, you are mixing two time frames in the indicator - this is complete nonsense. I am leaving the discussion.
Sorry, you are mixing two time frames in the indicator - this is complete nonsense. I am leaving the discussion.
I don't understand why it is nonsense. A value for example of a Moving Average of 20 candles in timeframe M2 is completely different from the Moving Average of 20 candles in H1, and can create different insights. But ok, I respect your opinion.
Anyway I thank you. Have a great week!
If you give up the idea of TWO timeframes in the indicator, I will help you. Here's an example:

If you give up the idea of TWO timeframes in the indicator, I will help you. Here's an example:
Great Vladimir!
For you to see better and understand why two timeframes, this is the visual result I would like: (Pic1: Example of EURUSD M5 Close vs High and Low of D1 timeframe candle ). Pic2: And the indicator code that I use on another platform.
- Free trading apps
- Over 8,000 signals for copying
- Economic news for exploring financial markets
You agree to website policy and terms of use
Hi! I'm trying to create a visual indicator (MT5) but I'm having difficulties (I only know the basics). I tried to modify a code available on the site, but without success (https://www.mql5.com/en/code/1349).
What I would like is:
Candle Green: Close is higher than the previous high: (C2 > H3) or (C3 > H4)
Candle Red: Close is less than the previous minimum: (C2 < L3) or (C3 < L4)
Candle Gray: No green or No red
Can someone help me? I'll appreciate a lot and pay you a coffee for your help :) Thank you!
Example: