Friendly bump.
To be clear, I am interested in an EA that will buy/sell when the Price crosses a Bollinger Band.
Check out the code: iBands Crossing and Returning
Trading strategy idea
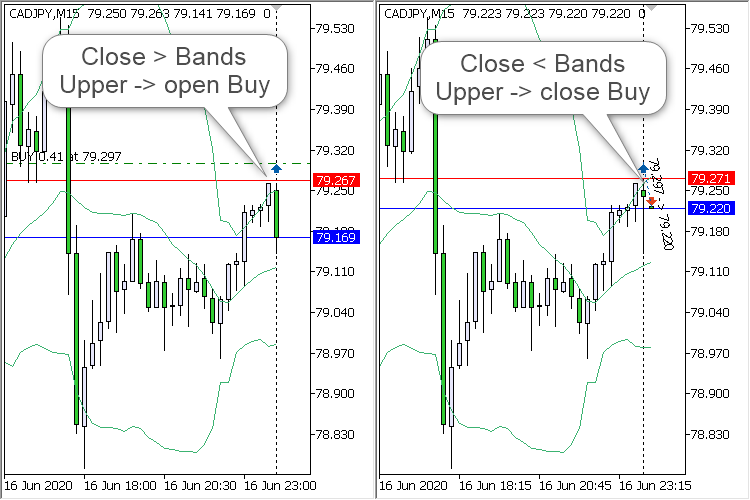
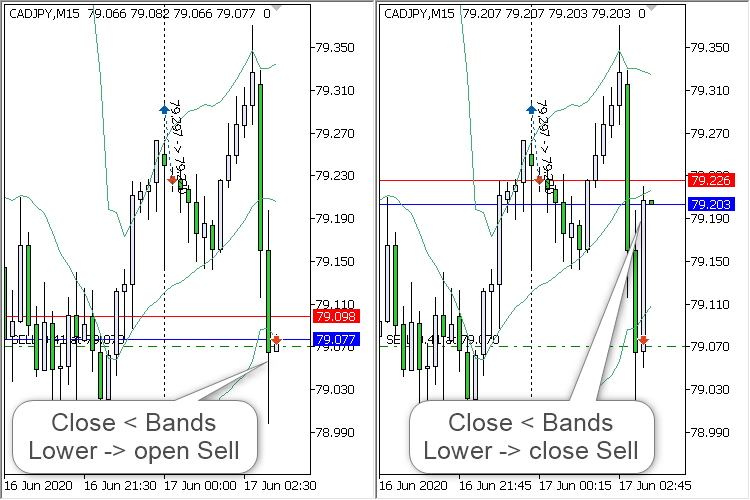
The Expert Advisor is configured for a simple trading system: we receive a signal from the iBands indicator (Bollinger Bands, BB) only at the moment of a new bar birth. Stop Loss, Trailing and Time Interval are disabled. There can be no more than one position in the market.

Figure: 1.iBands Crossing and Returning - opening and closing a BUY position

Figure: 2.iBands Crossing and Returning - opening and closing a SELL position
You are missing trading opportunities:
- Free trading apps
- Over 8,000 signals for copying
- Economic news for exploring financial markets
Registration
Log in
You agree to website policy and terms of use
If you do not have an account, please register
Ideally I want to trade equities and buy and/or sell when a Bollinger Band is crossed. Typical method. Although I may want to tweak things in the script. I can learn/do so once I have access to one. For instance, I can change the period or deviation or buy/sell if, if, if., etc.
Thank you.
EDIT: I use lines, but would switch to candles if that's the only way to do it.
To help visualize, here is an image. Yellow lines would be buys, orange lines would be sells. The 1 light blue line would be a sell but no action since I do not have any stock, since I sold it on the previous down move (preceding orange line): ***