Problems with charts
It is surprising that you do not have history for GBPUSD.
You can try right clicking on the chart and click "Refresh" or pressing the "Home" key on your keyboard.
Nothing, I also tried to delete and reinstal everything, but I'm still here in the same situation. And this occurs with every Symbol.
Try this:
- open "History center" from "Tools" menu (or press F2)
- find GBPUSD, click on D1, select all rows and delete them
- don't click "Download"
- open D1 chart
- right click on chart and click "Refresh"
This helped me once when I had a hole in data - there were last few candles and few candles way back in history and nothing in between.
If this doesn't help, ask your broker, maybe they really don't have that data (which would be unusual).
Nothing, I also tried to delete and reinstal everything, but I'm still here in the same situation. And this occurs with every Symbol.
It may be related to the broker.
You can load the history from the broker:
- in MT4 - Tools - History Center and so on;
- in MT5 - right mouse click on Market Watch - Bars - Ticks and so on.
For example -

- 2017.02.08
- www.mql5.com
Cristianson:
Hi,
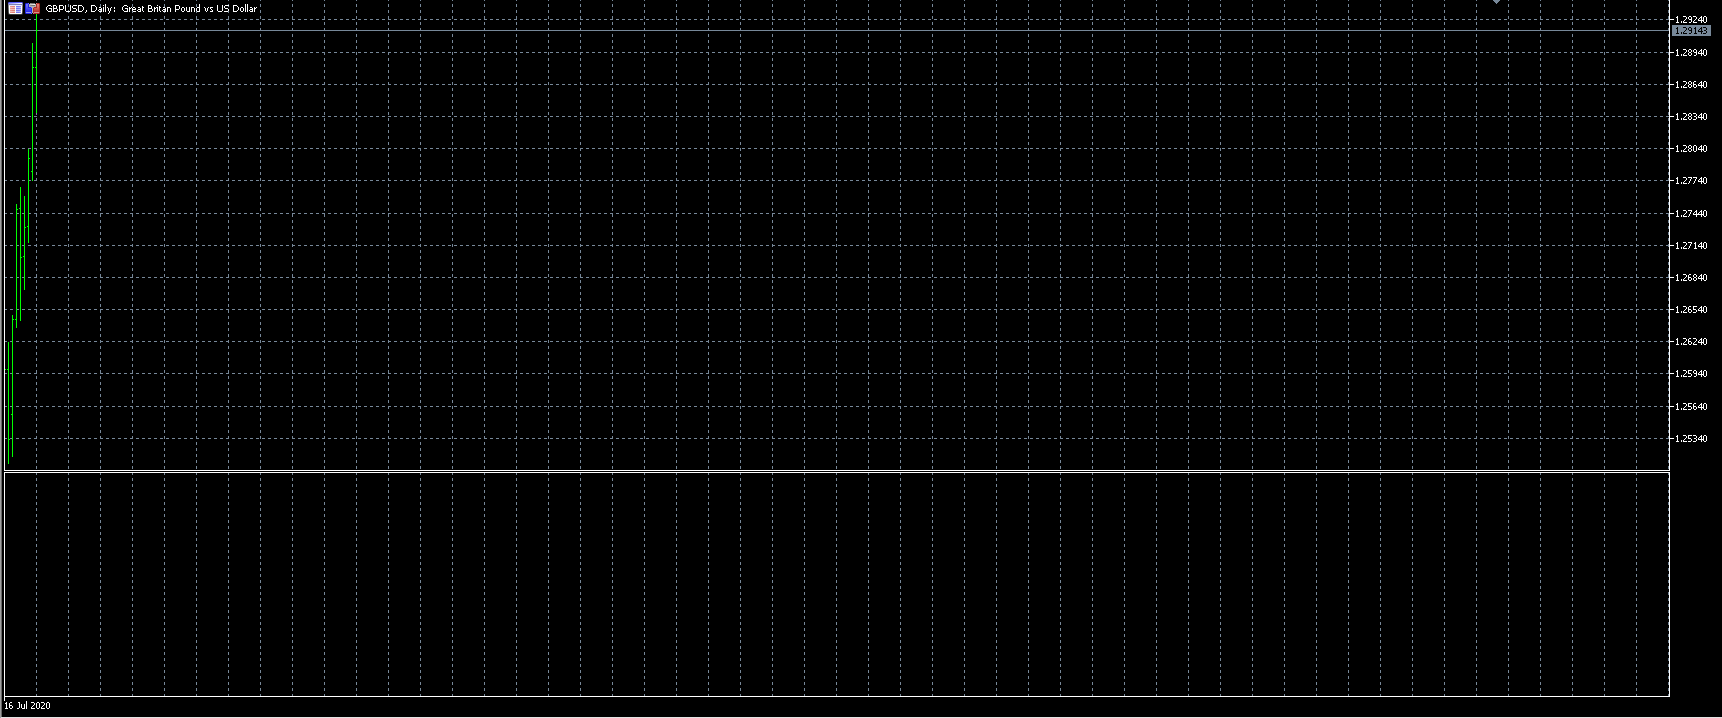
I have problems with daily, weekly and montlhy charts. I can't scroll horizontally. For example in the daily chart I can only see the last 5 candles but I can't move left. I'm stuck. And the same with weekly and monthly charts. Hope you can help me.
Hey, did you figure it out ? Have same issue, but i think it might be due to the internet connexion being slow atm..

- Free trading apps
- Over 8,000 signals for copying
- Economic news for exploring financial markets
You agree to website policy and terms of use
Hi,
I have problems with daily, weekly and montlhy charts. I can't scroll horizontally. For example in the daily chart I can only see the last 5 candles but I can't move left. I'm stuck. And the same with weekly and monthly charts. Hope you can help me.