Hi Guys
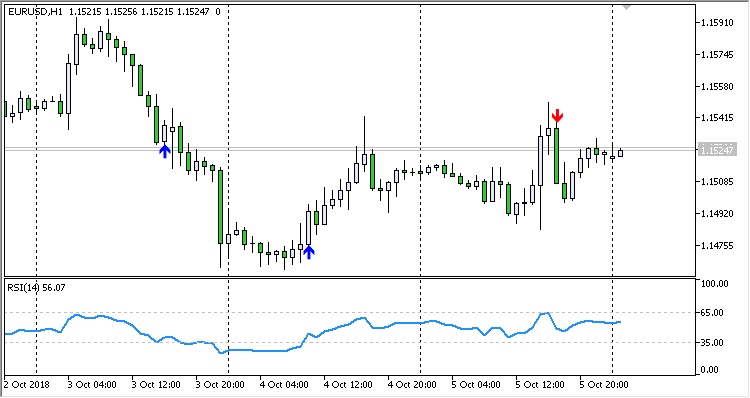
I was wondering if anyone has an indicator that draws an arrow when the RSI cross above the OB and below the OS. All i can find is arrows or alerts when the RSI enters the OB or OS zone. Im after an indicator that draws when the RSI exits the zones and candle closes.
Many Thanks
if you can't find one...have one created and there's an awesome place to visit for that purpose --------> Freelance

- www.mql5.com
Hi Guys
I was wondering if anyone has an indicator that draws an arrow when the RSI cross above the OB and below the OS. All i can find is arrows or alerts when the RSI enters the OB or OS zone. Im after an indicator that draws when the RSI exits the zones and candle closes.
Many Thanks
Especially for you:
Indicator based on iRSI (Relative Strength Index, RSI) - looks for the moments of EXIT from oversold and overbought zones

Posted by: Vladimir Karputov
- Free trading apps
- Over 8,000 signals for copying
- Economic news for exploring financial markets
You agree to website policy and terms of use
Hi Guys
I was wondering if anyone has an indicator that draws an arrow when the RSI cross above the OB and below the OS. All i can find is arrows or alerts when the RSI enters the OB or OS zone. Im after an indicator that draws when the RSI exits the zones and candle closes.
Many Thanks