Scale for MAs within indicator window
Hi,
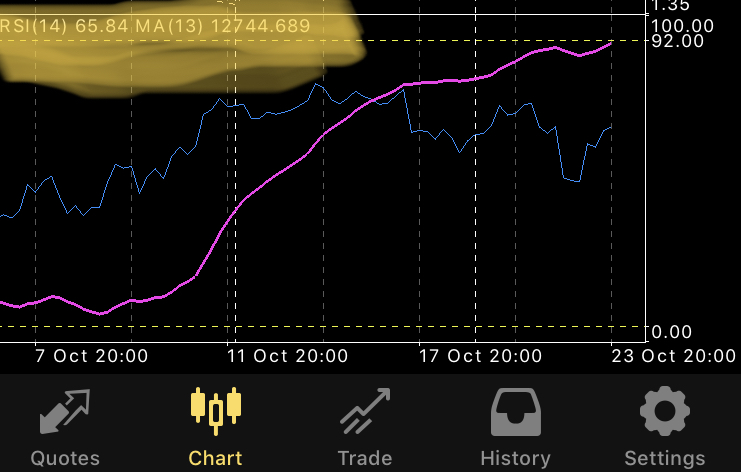
If you add a moving average into an indicator (like rsi) window (applies to closed bars), it will show the moving average of the price of the symbol of the chart. This is what I want, however I’m wondering how MT4 is defining the scale for those moving averages.
Example: if you have a indicator window for rsi, it has a scale of 0 to 100. If you add a moving average to this window (average of market price, not average of the rsi) how is MT4 defining how to plot it into 0-100 scale?
Does anyone know how this is done?
Thanks and regards,
Victor
- Technical analysis tools in MetaTrader 5
- Charts in MetaTrader 5 trading platform for Forex and stocks
- Web version features
Victor Christiaanse:
If you add a moving average into an indicator (like rsi) window (applies to closed bars), it will show the moving average of the price of the symbol of the chart.
This is what I want, however I’m wondering how MT4 is defining the scale for those moving averages.
Example: if you have a indicator window for rsi, it has a scale of 0 to 100. If you add a moving average to this window (average of market price, not
average of the rsi) how is MT4 defining how to plot it into 0-100 scale?
- Wrong. It will show a MA of whatever you specify. If you specify previous (or first) indicator, you get a MA(RSI). (Not all indicators
support previous option.)
- Unless the first indicator specifies a scale (like RSI,) the separate window scales from the lowest to the highest value of all indicators
on the window.
- It's not going to plot it scaled. You will see the RSI on the 0-100 scale, and a (almost) straight line at the 1.2345 price.
William Roeder:
If you don’t specify previous indicator but closed, how is it scaled in that case? In my example the moving average is not the average of the indicator but of the real market price. You can see that in the value of the MA. See the example in the uploaded file.
- Wrong. It will show a MA of whatever you specify. If you specify previous (or first) indicator, you get a MA(RSI).
- Unless the first indicator specifies a scale, the separate window scales from the lowest to the highest value of all indicators on the window.
- It's not going to plot it scaled. You will see the RSI on the 0-100 scale, and a (almost) straight line at the 1.2345 price.
Files:
Anyone who can help getting this clarified?
Thanks and regards,
Victor
Victor Christiaanse:
Anyone who can help getting this clarified?
Anyone who can help getting this clarified?
Thanks and regards,
Victor
nobody knows how this is defined?
kind regards,
Victor
Victor Christiaanse:
nobody knows how this is defined?
kind regards,
Victor
maybe god knows, but even MQ has no clue about it
You are missing trading opportunities:
- Free trading apps
- Over 8,000 signals for copying
- Economic news for exploring financial markets
Registration
Log in
You agree to website policy and terms of use
If you do not have an account, please register