Find same pattern Indicator?
Forum on trading, automated trading systems and testing trading strategies
Libraries: Cross-platform library of original mathematical functions
fxsaber , 2017.03.27 18:14
 // Индикатор показывает степень похожести каждого интервала истории с текущим интервалом

#property  indicator_separate_window

#property  indicator_buffers 1
#property  indicator_plots 1

#property  indicator_minimum - 1
#property  indicator_maximum 1

#property  indicator_color1 clrRed
#property  indicator_type1 DRAW_LINE
#property  indicator_width1 2

sinput int Amount = 100 ; // Количество последних баров (Паттерн)

#include  <fxsaber\Math\Math.mqh> // https://www.mql5.com/ru/code/17982

double Buffer[];

void OnInit ()
{
   SetIndexBuffer ( 0 , Buffer);
}

int OnCalculate ( const int rates_total,
                 const int prev_calculated,
                 const datetime &time[],
                 const double &open[],
                 const double &high[],
                 const double &low[],
                 const double &close[],
                 const long &tick_volume[],
                 const long &volume[],
                 const int &spread[] )
{
   if (rates_total > prev_calculated)
  {
     double Pattern[];

     ArrayCopy (Pattern, open, 0 , rates_total - Amount, Amount);

    MathCorrelationPearson(open, Pattern, Buffer);

     const int Pos = ArrayMaximum (Buffer, 0 , rates_total - Amount);

     Comment ( "Наиболее похожий участок истории, соответствующий последним (" +
          ( string )time[rates_total - 1 ] + ") " + ( string )Amount + " барам,\nнаходится здесь " +
          ( string )time[Pos] + " - КК Пирсона = " + ( string )Buffer[Pos]);
  }

   return (rates_total);
}
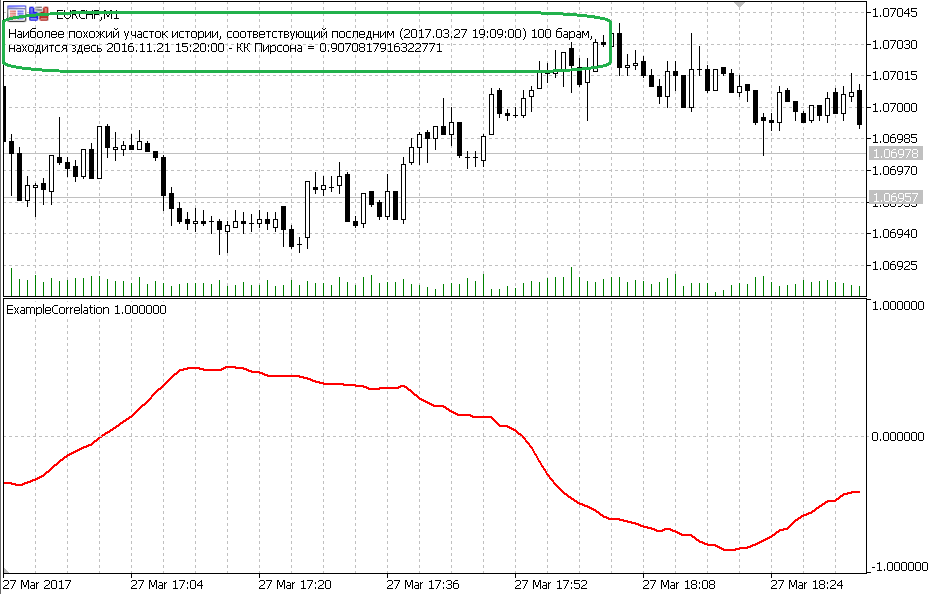
An example of how to quickly find the most similar (according to Pearson) piece of history.
The strength of implementation only in the algorithm is much faster than any other.
Forum on trading, automated trading systems and testing trading strategies
Libraries: Cross-platform library of original mathematical functions
fxsaber , 2017/10/19 10:16 p.m.
 // Пример нахождения "самого похожего" интервала на текущий (критерий - КК Пирсона).
#property  indicator_chart_window

#property  indicator_buffers 2
#property  indicator_plots 2

#property  indicator_color1 clrRed
#property  indicator_type1 DRAW_LINE
#property  indicator_width1 2

#property  indicator_color2 clrYellow
#property  indicator_type2 DRAW_LINE
#property  indicator_width2 2

sinput int inAmount = 20 ;   // Количество последних баров (Паттерн)
input int   inMaxBars = 1 e5; // Количество баров для анализа

#include  <fxsaber\Math\Math.mqh> // https://www.mql5.com/ru/code/17982

double Buffer0[];
double Buffer1[];
double Buffer2[];
int handle;

const long handleChart = ChartOpen ( _Symbol , PERIOD_CURRENT );

void OnInit ()
{
   SetIndexBuffer ( 0 , Buffer0);
   SetIndexBuffer ( 1 , Buffer1);

   PlotIndexSetString ( 0 , PLOT_LABEL , "Pattern" );
   PlotIndexSetString ( 1 , PLOT_LABEL , "Sample" );

   ChartSetInteger (handleChart, CHART_MODE , CHART_LINE );
   ChartSetInteger (handleChart, CHART_AUTOSCROLL , false );
}

//------
// Выдрано из Include\Math\Stat\Math.mqh - https://www.mql5.com/ru/forum/97153/page15#comment_5927026

const double QNaN   =( double ) "nan" ;   // QNaN

//+------------------------------------------------------------------+
//| Computes the mean value of the values in array[]                 |
//+------------------------------------------------------------------+
double MathMean( const double &array[])
  {
   int size= ArraySize (array);
//--- check data range
   if (size< 1 )
       return (QNaN); // need at least 1 observation
//--- calculate mean
   double mean= 0.0 ;
   for ( int i= 0 ; i<size; i++)
      mean+=array[i];
   mean=mean/size;
//--- return mean
   return (mean);
  }
//+------------------------------------------------------------------+
//| Computes the variance of the values in array[]                   |
//+------------------------------------------------------------------+
double MathVariance( const double &array[])
  {
   int size= ArraySize (array);
//--- check data range
   if (size< 2 )
       return (QNaN); // need at least 2 observations
//--- calculate mean
   double mean= 0.0 ;
   for ( int i= 0 ; i<size; i++)
      mean+=array[i];
   mean=mean/size;
//--- calculate variance
   double variance= 0 ;
   for ( int i= 0 ; i<size; i++)
      variance+= MathPow (array[i]-mean, 2 );
   variance=variance/ size ;
//--- return variance
   return (variance);
  }
//------

// Подгоняет Sample к Pattern
void NormalizeArray( const double &Pattern[], double &Sample[], const bool Reverse = false )
{
   const double MeanPattern = MathMean(Pattern);
   const double MeanSample = MathMean(Sample);
   const double Koef = (Reverse ? - 1 : 1 ) * MathSqrt (MathVariance(Pattern) / MathVariance(Sample));

   const int Total = ArraySize (Pattern);

   for ( int i = 0 ; i < Total; i++)
    Sample[i] = (Sample[i] - MeanSample) * Koef + MeanPattern;
}

void MathLog ( double &Array[] )
{
   for ( int i = ArraySize (Array) - 1 ; i >= 0 ; i--)
    Array[i] = MathLog (Array[i]);
}

void MathExp ( double &Array[] )
{
   for ( int i = ArraySize (Array) - 1 ; i >= 0 ; i--)
    Array[i] = MathExp (Array[i]);
}

// Находит лучший Sample по Pattern
int GetSample1( const int Amount, const double &Prices[], double &Sample[], double &Pattern[], int MaxBars )
{
   const int Total = ArraySize (Prices) - 1 ; // Убираем последний бар из расчетов

   ArrayCopy (Pattern, Prices, 0 , Total - Amount, Amount);

  MaxBars = (Total > MaxBars) ? MaxBars : Total;

   double Prices2[];
   ArrayCopy (Prices2, Prices, 0 , Total - MaxBars, MaxBars);
   MathLog (Prices2);

   double Pattern2[];
   ArrayCopy (Pattern2, Pattern);
   MathLog (Pattern2);

   double Pearson[];
   MathCorrelationPearson(Prices2, Pattern2, Pearson);

   const int PosMax = ArrayMaximum (Pearson, 0 , MaxBars - Amount);
   const int PosMin = ArrayMaximum (Pearson, 0 , MaxBars - Amount);

   const bool Res = ( MathAbs (Pearson[PosMax]) < MathAbs (Pearson[PosMin]));
   const int Pos2 = Res ? PosMin : PosMax;

   ArrayCopy (Sample, Prices2, 0 , Pos2 - Amount + 1 , Amount);
  NormalizeArray(Pattern2, Sample, Res);
   MathExp (Sample);

   return (Pos2 + Total - MaxBars);
}

void OnDeinit ( const int )
{
   ChartClose (handleChart);
}

int OnCalculate ( const int rates_total,
                 const int prev_calculated,
                 const datetime &time[],
                 const double &open[],
                 const double &high[],
                 const double &low[],
                 const double &close[],
                 const long &tick_volume[],
                 const long &volume[],
                 const int &spread[] )
{
   if (rates_total > prev_calculated)
  {
     double Pattern[];
     double Sample[];

     const int Pos = GetSample1(inAmount, close, Sample, Pattern, inMaxBars);

     // Вывели сам паттерн
     ArrayInitialize (Buffer0, EMPTY_VALUE );
     ArrayCopy (Buffer0, Pattern, rates_total - inAmount - 1 );

     // Вывели Sample
     ArrayInitialize (Buffer1, EMPTY_VALUE );
     ArrayCopy (Buffer1, Sample, rates_total - inAmount - 1 );

     Comment ( "Interval: " + ( string )time[Pos - inAmount + 1 ] + " - " + ( string )time[Pos]);

     // Показываем найденный участок
     const int Offset = 10 ;
     ChartNavigate (handleChart, CHART_BEGIN , Pos - inAmount + 1 - Offset); // Сдвигаем график на Offset-баров раньше начала источника Sample
     ObjectCreate (handleChart, "Left" , OBJ_VLINE , 0 , time[Pos - inAmount + 1 ], 0 );
     ObjectCreate (handleChart, "Right" , OBJ_VLINE , 0 , time[Pos], 0 );
  }

   return (rates_total);
}
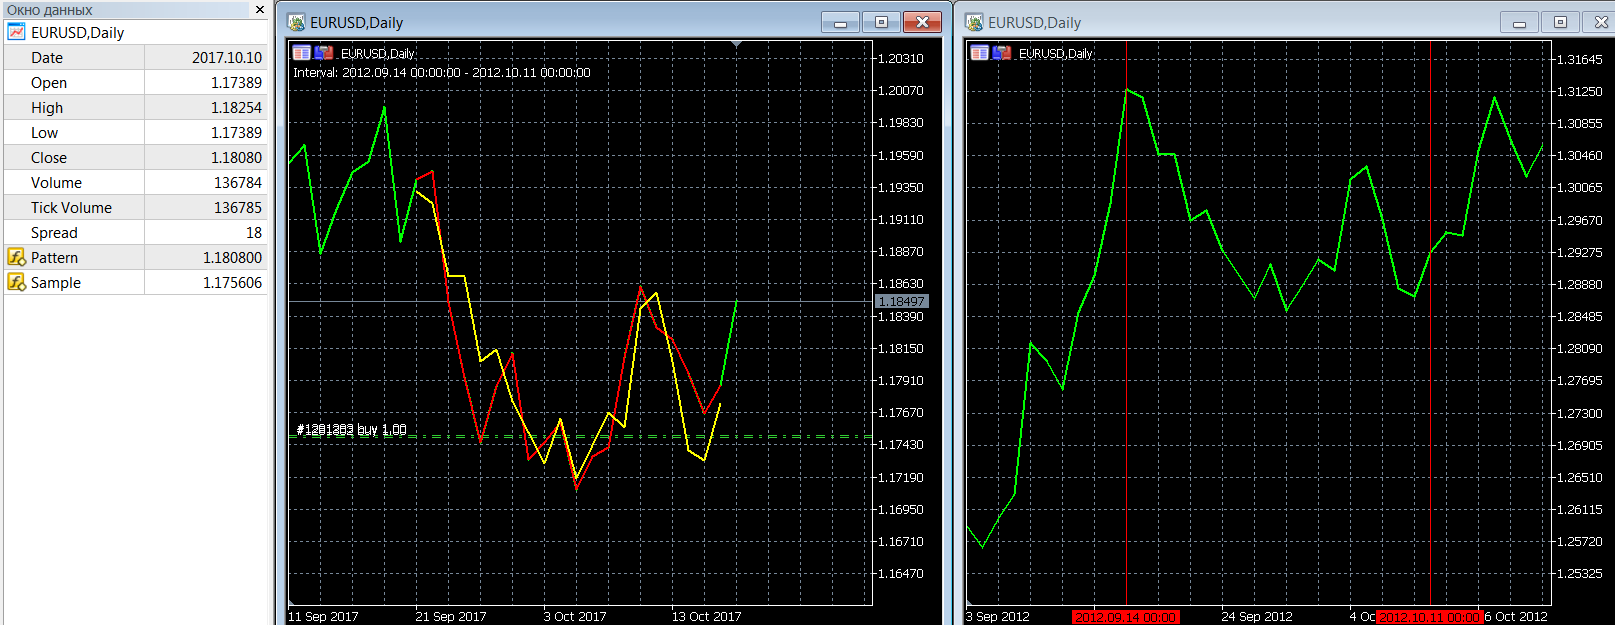
The library compiles for MT4, the indicator can be easily converted.
It is interesting for study, but not suitable for trading. There can be a multitude of high (>90) correlated patterns with different directions.
- Free trading apps
- Over 8,000 signals for copying
- Economic news for exploring financial markets
You agree to website policy and terms of use
Hello. I am wondering if there is an indicator that, taken a period of market movement (for example last week), it searches in all history of price to find a movement that is very similar, and makes the prevision based on the previous movement. I don't know what to search for... Does someone know how a similar indicator can be called?
Thank you