Forum on trading, automated trading systems and testing trading strategies
newdigital, 2013.10.14 14:40
Price Channels is a helpful technical analysis indicator to determine buy and sell signals based on price breakouts.
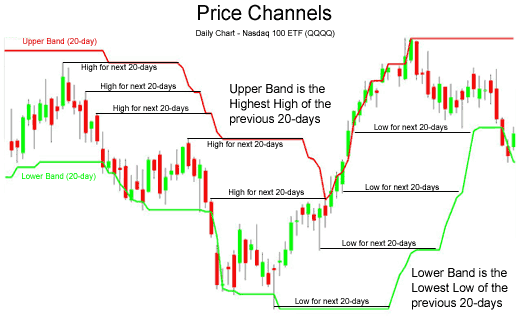
- Upper Price Channel: The highest high over a user-defined time period.
- Lower Price Channel: The lowest low over a user-defined time period.
The user-defined time period is generally 20 periods. To further illustrate how a price channel is created a chart of the Nasdaq 100 ETF (QQQQ) is shown below:

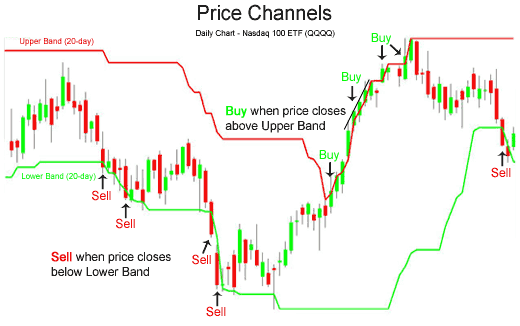
Price Channels are used mainly to identify price breakouts. The buy and sell signals are shown below in the chart of the QQQQ's:

Buy when price closes above upper bands. This is like buying a breakout above resistance, the resistance just happens to be whatever the highest high was of the past 20 trading days.
Price Channel Sell SignalSell when price closes below lower bands. This would be like selling a breakout below support, but the support in this case is whatever the lowest low was of the previous 20 trading days.
Price Channels offer an easy to follow method of buying and selling stocks, futures, or currency pairs.
Forum on trading, automated trading systems and testing trading strategies
newdigital, 2013.03.22 14:04
PriceChannel Parabolic system basic edition
- indicators and template to download for black background (first post of this thread)
- PriceChannel indicator is on CodeBase here, same for white background, how to install
- Clock indicator to be used with this trading system - Indicator displays three variants of time in the chart: local, server and GMT
- PriceChannel ColorPar Ichi system is on this post
Latest version of the system with latest EAs to download
- pricechannel_parabolic_system_v1 EA
- pricechannel_parabolic_system_v1_1 EA with updated indicator
- Fully updated EA with trading system is on this post and latest indicators to download
How to trade
- tp/sl levels and timeframes
- how to trade with explanation
- graphical illustration about where to enter and where to exit with latest version of the system
- how to use AFL Winner indicator with more explanation,
- Updated manual system with templates and indicators - this post
The settingas for EAs: optimization and backtesting
- optimization results for this EA for EURUSD H4
- backtesting results for EURUSD H4 with the settings #1
- backtesting results for EURUSD H4 with the settings #2
- optimization results for EURUSD M15
- backtesting results for EURUSD M15 with the settings #1
- optimization results for GBPUSD M15
- backtesting results for GBPUSD M15 with the settings #1
Trading examples
Metaquotes demo
- MT5 statement is here
- Updated statement is here
- More trading updates
- Updated MT5 statement
- More updates
- 811 dollars for 3 trading days and final statement for scalping
GoMarkets broker, initial deposit is 1,000
- statement (77 dollars in less than 1 hour)
Alpari UK broker initial deposit is 1,000
- statement (517 dollars for one day)
RoboForex broker initial deposit is 1,000
- first statement
- updated statement (257 dollars in 2 days)
- Free trading apps
- Over 8,000 signals for copying
- Economic news for exploring financial markets
You agree to website policy and terms of use
PChannel_System:
The indicator implements a breakthrough system using a channel drawn on extrema for a period.
When price exits the gray channel, the candlestick color changes to the color corresponding to trend direction. Blue for the growth of a financial asset, pink color - fall. Bright colors denote coincidence of trend direction and direction of a candlestick. Dark colors correspond to the situation when the direction of a candlestick is opposite to trend.
Author: Nikolay Kositsin