Discussion of article "Studying candlestick analysis techniques (Part II): Auto search for new patterns"
It would be useful to divide the analysed interval into 2 segments - select promising patterns on one segment, and check their consistency on the second segment (analogue of in- and out-of-sample).
Or make the interval setting from both sides, so that you could limit the analysed interval manually.
It would be useful to divide the analysed interval into 2 segments - on one segment to select promising patterns, and on the second segment to check their consistency (analogue of in- and out-of-sample).
Or make the interval setting from both sides, so that you can limit the analysed interval manually.
I meant to count K on one piece and check on another.
Candlestick classical models do not take into account important "internal" candlestick parameters, namely: the ratio of candlestick body to candlestick amplitude, the depth of correction inside the candlestick, the relative amplitude of candlestick shadows.
All this reflects the dynamics of the process very well. If we add these parameters, the forecasting will improve significantly (especially if we use such analysis simultaneously on several scales). Actually, this is done in the impulse equilibrium theory.
Is it possible to sort by any value? Or is it possible to upload the table to Excel?
Is it possible to sort by any value? Or is it possible to upload the table to Excel?
I will take into account in the future update.
I will take it into account in the future update.
I wanted to start candlestick analysis myself, and now I have such a gift in the form of a wonderful EA from you, Alexander.
Well then, I have more suggestions.
The Expert Advisor does not see the instruments of the Russian stock exchange. It sees only the instrument on the chart of which the Expert Advisor is running. Not critical.
It is necessary to choose the testing period, not just the last candles.
It would be nice to be able to test patterns one by one. We find promising patterns on a small period of time, and then run them one by one on a larger period of time. That's how it is roughly.
Using candlestick analysis just head-on did not give positive results. Wrote a simple trading advisor, which trades on the results of testing .
This is the RTS index gluing contracts.
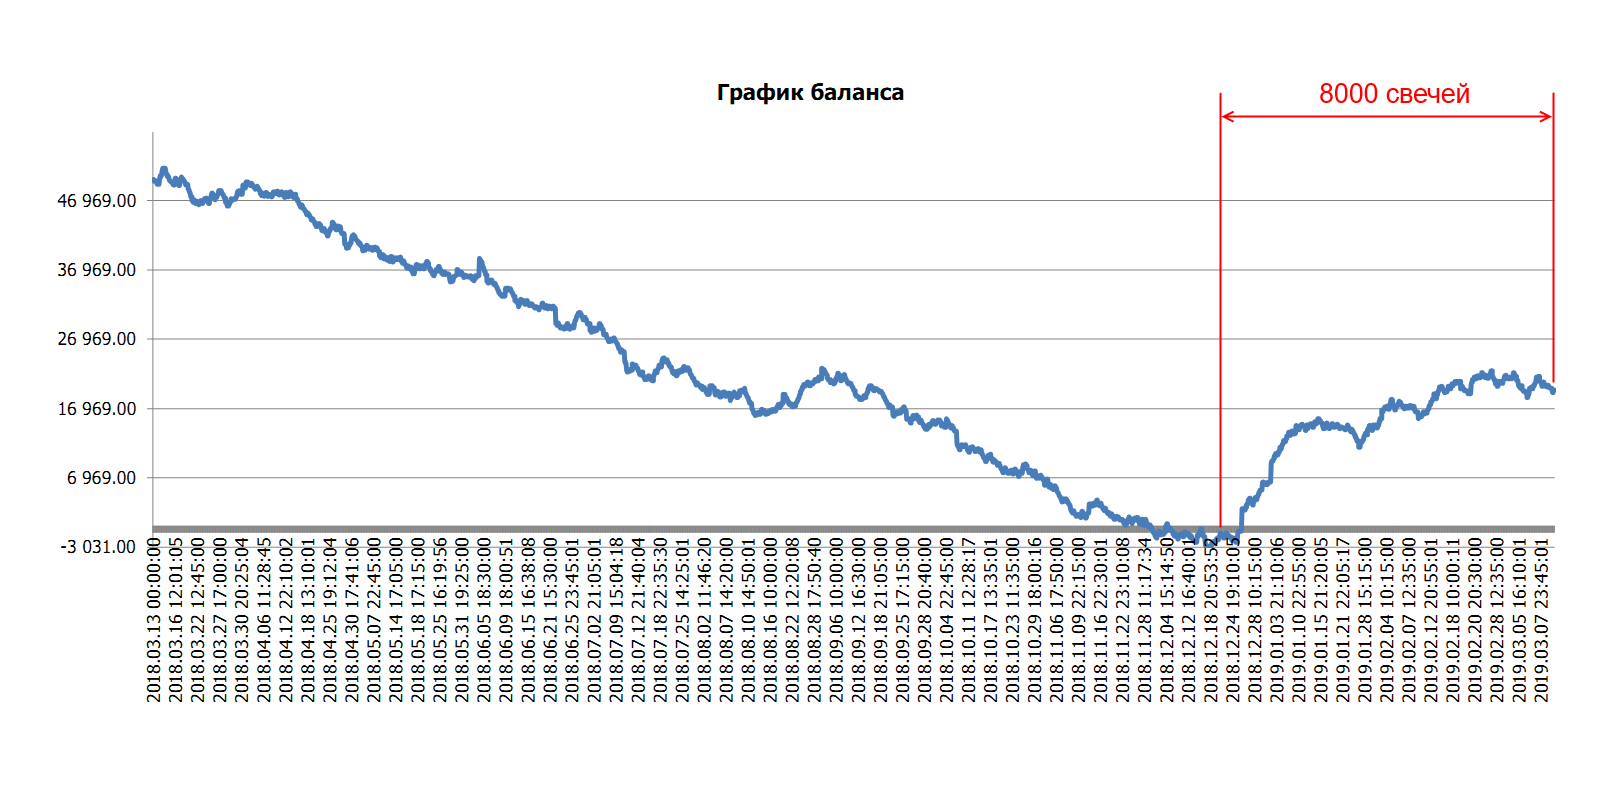
P.S. While writing, I thought that maybe I have something wrong with the RTS index. Since the testing of the Expert Advisor trading on the patterns of internal and external bars, showed positive results for the last two months and negative results if you test the period of a year. I will check what results will be obtained on the CME.
I will take it into account in the future update.
And if it is not difficult, please tell me in a future article how to import perspective patterns. The code is not simple and it is difficult for non-advanced people to understand what is written where and from where and from which buffer the results can be taken.
It takes a long time to do it by hand, and there are quite a lot of patterns. Only for purchase I have the following selection of promising ones on M5
         if(paternDn(4,3,2,i,close[i]))
         if(paternDn(8,2,9,i,close[i]))
         if(paternDn(2,2,5,i,close[i]))
         if(paternDn(9,5,3,i,close[i]))
         if(paternDn(2,2,9,i,close[i]))
         if(paternDn(9,8,1,i,close[i]))
         if(paternDn(2,9,8,i,close[i]))
         if(paternDn(9,8,2,i,close[i]))
         if(paternDn(6,9,8,i,close[i]))
         if(paternDn(8,1,3,i,close[i]))
         if(paternDn(9,8,5,i,close[i]))
         if(paternDn(2,8,8,i,close[i]))
         if(paternDn(5,1,2,i,close[i]))
         if(paternDn(9,2,2,i,close[i]))
         if(paternDn(5,2,2,i,close[i]))
         if(paternDn(4,2,2,i,close[i]))
         if(paternDn(3,4,8,i,close[i]))
         if(paternDn(8,8,6,i,close[i]))
         if(paternDn(1,1,2,i,close[i]))
         if(paternDn(4,8,5,i,close[i]))
         if(paternDn(9,2,1,i,close[i]))
         if(paternDn(8,4,9,i,close[i]))
         if(paternDn(9,8,9,i,close[i]))
         if(paternDn(9,2,2,i,close[i]))
         if(paternDn(8,2,8,i,close[i]))
         if(paternDn(4,9,1,i,close[i]))
         if(paternDn(3,2,9,i,close[i]))
         if(paternDn(1,6,9,i,close[i]))
         if(paternDn(8,5,8,i,close[i]))
         if(paternDn(8,9,9,i,close[i]))
         if(paternDn(9,2,9,i,close[i]))
         if(paternDn(3,3,8,i,close[i]))
         if(paternDn(1,8,1,i,close[i]))
         if(paternDn(8,8,1,i,close[i]))
         if(paternDn(8,10,11,i,close[i]))
         if(paternDn(8,8,10,i,close[i]))
         BuffDn[i]=EMPTY_VALUE;
And if it is not difficult to tell in the future article how to import perspective patterns. The code is quite simple and for the non-advanced it is difficult to understand what is written where and from where and from which buffer the results can be taken.
It takes a long time to do it by hand, and there are quite a lot of patterns. Only for purchase I have the following selection of promising ones on M5
- Free trading apps
- Over 8,000 signals for copying
- Economic news for exploring financial markets
You agree to website policy and terms of use
New article Studying candlestick analysis techniques (Part II): Auto search for new patterns has been published:
In the previous article, we analyzed 14 patterns selected from a large variety of existing candlestick formations. It is impossible to analyze all the patterns one by one, therefore another solution was found. The new system searches and tests new candlestick patterns based on known candlestick types.
In order to develop the new candlestick pattern generation algorithm, we need to define the key rules:
The general scheme of new pattern creation is shown in Figure 1.
Fig.1 New pattern creation algorithms.
Thus we have a certain pool of candlesticks, of which new patterns will be formed. These new patterns will contain 1-3 candlesticks with or without repetitions. The pool will totally contain 11 basic candlesticks. Generated candlestick patterns will be analyzed according the same principle, which was discussed in the first article.
Author: Alexander Fedosov