OnCalculate close price difference of each bar indicator
#property indicator_separate_window
#property indicator_buffers 2
#property indicator_plots   2
//--- plot Bars
#property indicator_label1  "Bars"
#property indicator_type1   DRAW_HISTOGRAM
#property indicator_color1  clrGreen
#property indicator_style1  STYLE_SOLID
#property indicator_width1  2
//--- plot Bars
#property indicator_label2  "Bars"
#property indicator_type2   DRAW_HISTOGRAM
#property indicator_color2  clrRed
#property indicator_style2  STYLE_SOLID
#property indicator_width2  2
//#property indicator_maximum 5
//#property indicator_minimum 0.000


//--- input parameter
input int      pip=1;         // Number of pip
//--- An indicator buffer for the plot
double         LineBuffer1[];
double         LineBuffer2[];
//+------------------------------------------------------------------+
//| Custom indicator initialization function                         |
//+------------------------------------------------------------------+
int OnInit()
  {
//--- Binding an array and an indicator buffer
   SetIndexBuffer(0,LineBuffer1,INDICATOR_DATA);
   SetIndexBuffer(1,LineBuffer2,INDICATOR_DATA);
//--- Initializing the generator of pseudo-random numbers

//---
   return(INIT_SUCCEEDED);
  }
//+------------------------------------------------------------------+
//| Custom indicator iteration function                              |
//+------------------------------------------------------------------+
int OnCalculate(const int rates_total,
                const int prev_calculated,
                const datetime &time[],
                const double &open[],
                const double &high[],
                const double &low[],
                const double &close[],
                const long &tick_volume[],
                const long &volume[],
                const int &spread[])
  {
   int i,limit;
   double diff;

   if(prev_calculated==0)
      limit=1;
   else
      limit=prev_calculated-1;

//--- Block for calculating indicator values
   for(i=limit;i<rates_total;i++)
     {
      diff=(close[i]-close[i-1])/_Point/10;
      if(diff>0)
        {
         LineBuffer1[i] = diff/pip;
         LineBuffer2[i] = 0.0;
        }
      else
        {
         LineBuffer2[i] = diff/pip;
         LineBuffer1[i] = 0.0;
        }
      //if(i>= 1 && (close[i] - close[i-1] >= pip*_Point))
      //{
      //LineBuffer[i]=1;
      //}
     }

//--- Return the prev_calculated value for the next call of the function
//int bars=Bars(Symbol(),0);
//Print("Bars = ",bars,", rates_total = ",rates_total,",  prev_calculated = ",prev_calculated);
   Print("time[0] = ",time[0]," time[rates_total-1] = ",time[rates_total-1]);
   Print(close[rates_total-1]);
//--- return value of prev_calculated for next call
   return(rates_total);
  }
//+------------------------------------------------------------------+
Thanks for the reply, i'm trying to understand it as well, a few question that i hope you could clarify with me :)
1 - What does the value of buffer property mean? I've read the manual but am not too sure if i understood it fully.
2 - Does the prev_calculated indicates tick or bars?
3 - why is diff /_Point but not *_Point ? I've been using *_Point , has it any impact?
4 - When SetIndexBuffer(0,LineBuffer1,INDICATOR_DATA); does the 0 indicate the plot bars set above?
5 - Does the close[i] refer to bar or tick? Cause when i look into the journal part, i saw a bunch of it, so i'm not too sure.
6 - Does OnCalculate calls everytick ? How often does it loop? Is that why my bar keeps shooting up when i uses LineBuffer[] = LineBuffer[] + 1;
Thanks alot Naguisa
Extra Question
is it possible to do calculation of pips hit ? Say starting from 1.10 i want it to indicate each time it increases by 0.02 or decrease by 0.02 but within a bar or chronological way, because some bars might be hitting +0.02, +0.02, - 0.02 and +0.02 but the result would only show +0.04 and with no chronological timeframe
1. Draw green and red histograms. Learn by yourself.
2. It's a number of bars which has been calculated.
(1 / _Point) 1 / 0.001 = 1000 point (100 pips)
4. What do you mean? 0 and 1 are buffer numbers.
5. The buffer of bars.
6. Yes, every few seconds - tens of seconds, depends on the market situation.
Thanks! Great help!
is it possible to have OnCalculate to do calculation based on every past tick instead of bars? If they could, can you point me in the direction? TQ
It is impossible.
For example, 5-minute data is the value which accumulated 5 minutes of tick data.
You can not calculate based on tick data.
Thanks for the reply,
i've used your advice to modify the code to this
#property indicator_separate_window
#property indicator_buffers 2
#property indicator_plots   2
//--- plot Bars
#property indicator_label1  "Bars"
#property indicator_type1   DRAW_HISTOGRAM
#property indicator_color1  clrGreen
#property indicator_style1  STYLE_SOLID
#property indicator_width1  2
//--- plot Bars
#property indicator_label2  "Bars"
#property indicator_type2   DRAW_HISTOGRAM
#property indicator_color2  clrRed
#property indicator_style2  STYLE_SOLID
#property indicator_width2  2
//#property indicator_maximum 5
//#property indicator_minimum 0.000


//--- input parameter
input int      pip=100;         // Number of pip
//--- An indicator buffer for the plot
double         LineBuffer1[];
double         LineBuffer2[];
double         startP;
//+------------------------------------------------------------------+
//| Custom indicator initialization function                         |
//+------------------------------------------------------------------+
int OnInit()
  {
//--- Binding an array and an indicator buffer
   SetIndexBuffer(0,LineBuffer1,INDICATOR_DATA);
   SetIndexBuffer(1,LineBuffer2,INDICATOR_DATA);
//--- Initializing the generator of pseudo-random numbers

//---
   return(INIT_SUCCEEDED);
  }
//+------------------------------------------------------------------+
//| Custom indicator iteration function                              |
//+------------------------------------------------------------------+
int OnCalculate(const int rates_total,
                const int prev_calculated,
                const datetime &time[],
                const double &open[],
                const double &high[],
                const double &low[],
                const double &close[],
                const long &tick_volume[],
                const long &volume[],
                const int &spread[])
  {
   int i,limit;
   double diff;

      Comment ("Pip x _Point : ",pip*_Point,"\n",
            "This : ",open[0],"\n",
            "Rates Total : ",rates_total,"\n",
            "Prev_Calc : ",prev_calculated,"\n",
            "Start Price : ",startP,"\n"
            );


   if(prev_calculated==0)
   {
      limit=1;
      startP = open[0];
      }
   else
   {
      limit=prev_calculated-1;
      }

//--- Block for calculating indicator values
   for(i=limit;i<rates_total;i++)
     {
      diff=(close[i]-startP);
      if(diff>=(pip*_Point))
        {
         startP = close[i];
         LineBuffer1[i] = MathFloor(diff/(pip*_Point));
         LineBuffer2[i] = 0.0;
        }
      else if((diff*-1)>(pip*_Point))
        {
         startP = close[i];
         LineBuffer2[i] = MathFloor((diff*-1)/(pip*_Point));
         LineBuffer1[i] = 0.0;
        }
     else
     {
     LineBuffer2[i] = 0.0;
     LineBuffer1[i] = 0.0;
     }
      //if(i>= 1 && (close[i] - close[i-1] >= pip*_Point))
      //{
      //LineBuffer[i]=1;
      //}
     }

//--- return value of prev_calculated for next call
   return(rates_total);
  }
//+------------------------------------------------------------------+
getting close to what i want
Starting from close[0] it calculates onwards, once it reaches a certain pip count, it'll label LineBuffer and reset itself.
My new question is that,how can i use the data from my indicator? Currently it look like this.
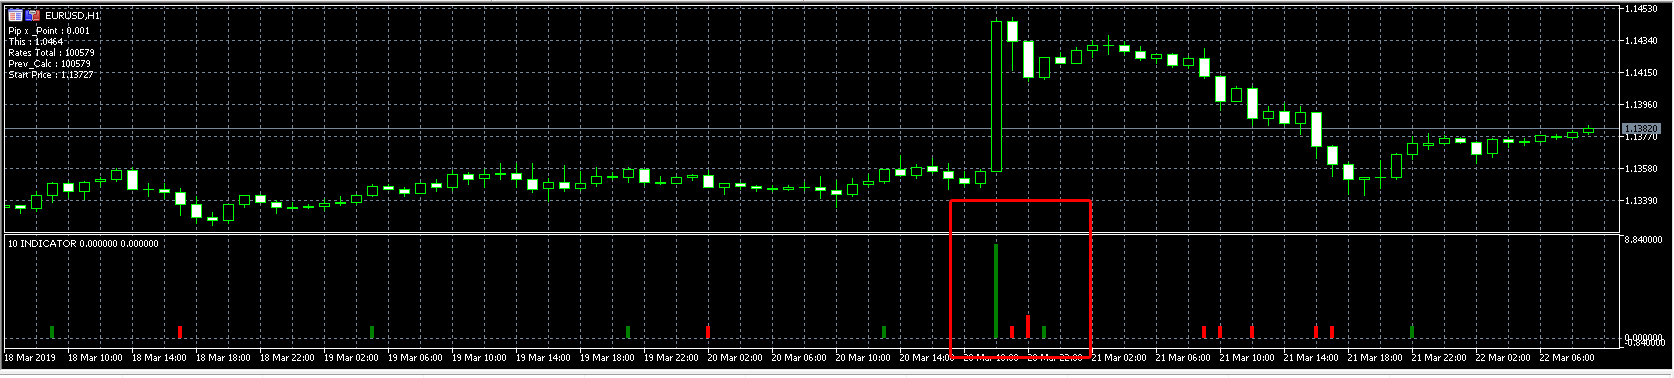
if you notice the red highlighted zone, a long green bar (8) with 2 shorter red (1 and 2) and 1 green (1) on its right.
how can i compare the result of this?
I want to read it so that if i get any result of > 1 continuously (as the above highlighted area) i would to perhaps put it in a variable or comment such as
Continuous 4 is 1
depending on result.
- Free trading apps
- Over 8,000 signals for copying
- Economic news for exploring financial markets
You agree to website policy and terms of use
I'm pretty new to mql5 and are trying to create an indicator, what i want is simple, but i seem to be missing something from it.
I want to compare the close price of the 2 bars by the minute, if it is more than a certain value, it adds 1 to a indicator (Array?)
So Say
Bar A-1 closes at 1.555
Bar A closes at 1.455
each 0.01 it shall add 1 to the bar indicator, hence there should be a bar with a value of 10.
yet when i tested it, it seem that close[i] is called every tick instead of every bar, and i can't seem to get the LineBuffer indicator to show the difference of close[i] and close[i-1] (hence i stuck it with 1 to get an indicator it has a difference more than the value called pip)