Very Simple and Powerful EMA Crossing Strategy
It is not same but similar -
EMA Cross Contest Hedged - expert for MetaTrader 5
EMA Cross Contest Hedged - expert for MetaTrader 4It is not same but similar -
EMA Cross Contest Hedged - expert for MetaTrader 5
EMA Cross Contest Hedged - expert for MetaTrader 4any ideas to make this strategy more accurate? how can we filter more wrong signals? any suggestions?
An interesting vision of the market. Probably I will start writing MQL5 code.
Hello Traders!
I appreciate if you leave me your valuable comments and opinions on this simple strategy which has been designed based on the standard indicators of MetaTrader. It uses only EMA and MACD.
First I consider H4 as my trading timeframe. Keeping this in mind, I look to the higher timeframe (Weekly chart) to detect the trend. If the price is above the EMA 10 and EMA 20 and these two EMAs have been crossed recently, I go to the timeframe of H4 and wait for triggers.
Same as weekly chart, when EMA 10 crosses EMA 20 to the up and MACD is in positive phase, I can open a long position.
This rules apply for sell if opposite conditions are met.
In the following picture, you can see that we had a losing trade since the MACD phase was not aligned to our strategy. (Pink area)
Hope to receive your opinions in this regards.
I threw two iMA indicators on USDCAD, W1:
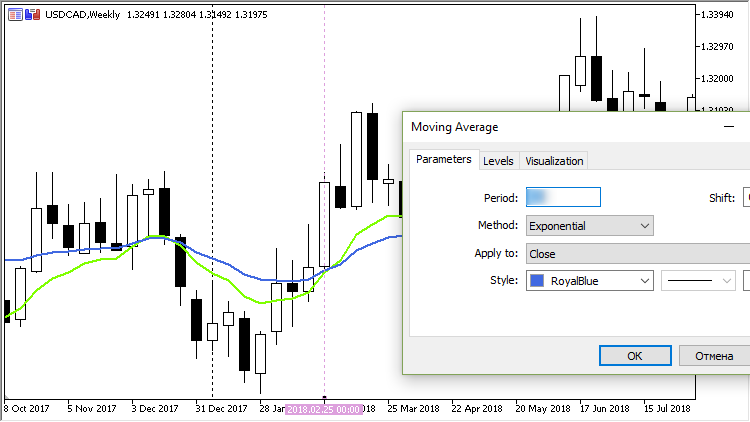
The averaging period is 10 and 20. But my intersection does not coincide with yours
But the option when using the trend indicators "Double Exponential Moving Average":
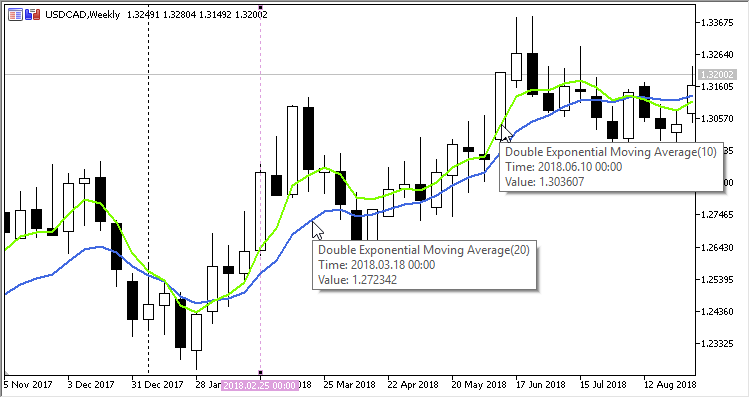
Pay attention - here intersections appear much earlier.
how looking for detect the trend when trader making decision to buy and sell?
Sorry for late reply. I look to the higher timeframe (Weekly chart) to detect the trend. When the price is over the EMA10 and EMA20 and also EMA10 is over EMA20, we have up trend.
In general, if interested, the framework of the adviser can be checked here: iDEMA Crossing iMACD Filter
Thanks a lot. Would you please generate it for MT4 too?
- Free trading apps
- Over 8,000 signals for copying
- Economic news for exploring financial markets
You agree to website policy and terms of use
Hello Traders!
I appreciate if you leave me your valuable comments and opinions on this simple strategy which has been designed based on the standard indicators of MetaTrader. It uses only EMA and MACD.
First I consider H4 as my trading timeframe. Keeping this in mind, I look to the higher timeframe (Weekly chart) to detect the trend. If the price is above the EMA 10 and EMA 20 and these two EMAs have been crossed recently, I go to the timeframe of H4 and wait for triggers.
Same as weekly chart, when EMA 10 crosses EMA 20 to the up and MACD is in positive phase, I can open a long position.
This rules apply for sell if opposite conditions are met.
In the following picture, you can see that we had a losing trade since the MACD phase was not aligned to our strategy. (Pink area)
Hope to receive your opinions in this regards.