Draw two fixed horizontal lines in the chart.
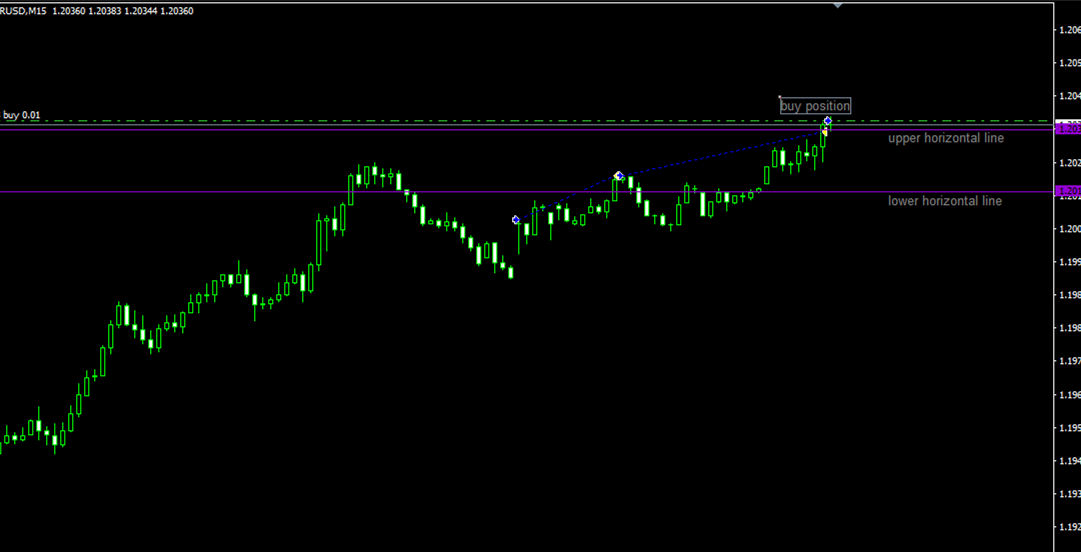
Happy new year to everybody. I am still studying mql4 and the idea of putting two fixed horizontal lines on the chart is difficult to code. My idea is that...I have 1 open trade in the chart. for example, a "buy trade" and i want to put automatically the two horizontal lines below the OrderOpenPrice (like OrderOpenPrice - 4pips below and the other will 20pips below the OrderOpenPrice. I tried to study some scripts which is available in this website but still i cannot get the idea,because the example in here is a moving horizontal line based on the price. In this picture, I manually attached the horizontal lines; and i want to make a code that will attached it directly as the EA open a trade position, I hope that theres someone who is generous that can help me in terms of coding.... Happy new year again and God Bless you all...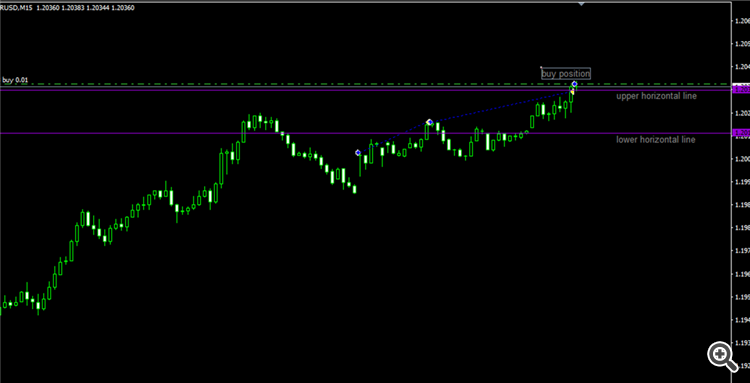
- Create Two Horizontal Lines in the Current Chart
- Code that will determine the price of the close of the previous candle
- Function that will delete horizontal lines in a specific chart.
// Functions:
//- HLineCreate()
//- HLineMove()
//- HLineDelete()

//+------------------------------------------------------------------+
//| Create the horizontal line                                       |
//+------------------------------------------------------------------+
bool HLineCreate(const long            chart_ID=0,        // chart's ID
                 const string          name="HLine",      // line name
                 const int             sub_window=0,      // subwindow index
                 double                price=0,           // line price
                 const color           clr=clrRed,        // line color
                 const ENUM_LINE_STYLE style=STYLE_SOLID, // line style
                 const int             width=1,           // line width
                 const bool            back=false,        // in the background
                 const bool            selection=true,    // highlight to move
                 const bool            hidden=true,       // hidden in the object list
                 const long            z_order=0)         // priority for mouse click
  {
//--- if the price is not set, set it at the current Bid price level
   if(!price)
      price=SymbolInfoDouble(Symbol(),SYMBOL_BID);
//--- reset the error value
   ResetLastError();
//--- create a horizontal line
   if(!ObjectCreate(chart_ID,name,OBJ_HLINE,sub_window,0,price))
     {
      Print(__FUNCTION__,
            ": failed to create a horizontal line! Error code = ",GetLastError());
      return(false);
     }
//--- set line color
   ObjectSetInteger(chart_ID,name,OBJPROP_COLOR,clr);
//--- set line display style
   ObjectSetInteger(chart_ID,name,OBJPROP_STYLE,style);
//--- set line width
   ObjectSetInteger(chart_ID,name,OBJPROP_WIDTH,width);
//--- display in the foreground (false) or background (true)
   ObjectSetInteger(chart_ID,name,OBJPROP_BACK,back);
//--- enable (true) or disable (false) the mode of moving the line by mouse
//--- when creating a graphical object using ObjectCreate function, the object cannot be
//--- highlighted and moved by default. Inside this method, selection parameter
//--- is true by default making it possible to highlight and move the object
   ObjectSetInteger(chart_ID,name,OBJPROP_SELECTABLE,selection);
   ObjectSetInteger(chart_ID,name,OBJPROP_SELECTED,selection);
//--- hide (true) or display (false) graphical object name in the object list
   ObjectSetInteger(chart_ID,name,OBJPROP_HIDDEN,hidden);
//--- set the priority for receiving the event of a mouse click in the chart
   ObjectSetInteger(chart_ID,name,OBJPROP_ZORDER,z_order);
//--- successful execution
   return(true);
  }
//+------------------------------------------------------------------+
//| Move horizontal line                                             |
//+------------------------------------------------------------------+
bool HLineMove(const long   chart_ID=0,   // chart's ID
               const string name="HLine", // line name
               double       price=0)      // line price
  {
//--- if the line price is not set, move it to the current Bid price level
   if(!price)
      price=SymbolInfoDouble(Symbol(),SYMBOL_BID);
//--- reset the error value
   ResetLastError();
//--- move a horizontal line
   if(!ObjectMove(chart_ID,name,0,0,price))
     {
      Print(__FUNCTION__,
            ": failed to move the horizontal line! Error code = ",GetLastError());
      return(false);
     }
//--- successful execution
   return(true);
  }
//+------------------------------------------------------------------+
//| Delete a horizontal line                                         |
//+------------------------------------------------------------------+
bool HLineDelete(const long   chart_ID=0,   // chart's ID
                 const string name="HLine") // line name
  {
//--- reset the error value
   ResetLastError();
//--- delete a horizontal line
   if(!ObjectDelete(chart_ID,name))
     {
      Print(__FUNCTION__,
            ": failed to delete a horizontal line! Error code = ",GetLastError());
      return(false);
     }
//--- successful execution
   return(true);
  }
//+------------------------------------------------------------------+
I have been using it for many, many years and it always works for me.
Marco vd Heijden:
I have been using it for many, many years and it always works for me.
I have been using it for many, many years and it always works for me.
I tried it again and it works, but of now i need to know how to add another line because i need two line. and as of now only 1 horizontal lines appears
They need to have different names.
Marco vd Heijden:
They need to have different names.
They need to have different names.
happy new year sir... so i need to assign different names? and the location? with the same properties and other parameters? Okay, i will try it.. i hope that i can discover it...
You are missing trading opportunities:
- Free trading apps
- Over 8,000 signals for copying
- Economic news for exploring financial markets
Registration
Log in
You agree to website policy and terms of use
If you do not have an account, please register