exporting horizontal line data
Write a script that loops through all objects on the chart, detects OBJ_HLINE's, dumps the values to a .csv file. CSV files are easily opened by Excel.
I seem to recall Leibniz created calculus because he was being lazy. This is a perfectly acceptable and valid reason to write such a script.
Here's a good starting point:
and if you aren't a coder, you can do it this way:
Thank you, lazy also equates to that I am hopeless at writing code but I am sure a little Youtube Searching should help me but thanks a million for pointing me in the right direction
Hi,
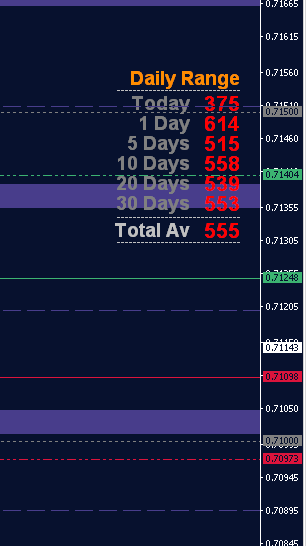
Just wondering is there an easy way of exporting data from MT4 to excel. What I have are 2 - 8 horizontal lines on a chart daily and I would like to export those line levels to excel. I am being lazy as ti update my spreadsheet daily on all charts I monitor takes me about 90 mins so this would be 90 minutes I can get back to further analysis.
Thanks in advance
This is pretty ambiguous. Why don't you share a table of what your output (spreadsheet) would look like.
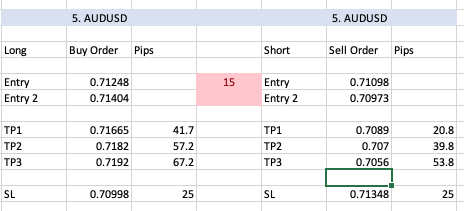
OK this is what the chart looks like and this is what the spreadsheet ultimately looks like but I am able to manipulate the CSV to update what I want
- Free trading apps
- Over 8,000 signals for copying
- Economic news for exploring financial markets
You agree to website policy and terms of use
Hi,
Just wondering is there an easy way of exporting data from MT4 to excel. What I have are 2 - 8 horizontal lines on a chart daily and I would like to export those line levels to excel. I am being lazy as ti update my spreadsheet daily on all charts I monitor takes me about 90 mins so this would be 90 minutes I can get back to further analysis.
Thanks in advance