How to nullify scaling difference in indicator window?
I have plotted the same real candles as it is from the chart 0 to indicator sub window.
The I drag and dropped the bollinger bands on both the windows. I found a hell lot of difference in the bands scale or placement inside the window. I do not understand how to get it right. Please help me.
Here is the image that will show you my attempt.:
Please let me know the way to even the scales.
It seems that you plotted the very same real candles on the sub window not using the values of its scale. your MIN and MAX from both scales are totally different. That why the Bollinger Bands are different. There is nothing wrong with the Bands, your candles are using a messed up scale...
Did you try to play with INDICATOR_MINIMUM /MAXIMUM?
;)
Can you help me? Can you show m please? I haven't tried it yet. I was thinking that the scale must get automatically managed by the chart itself. Is there any automatic way out? I would appreciate if I do not have to set the scale all the time but it should automatically get adjusted.
What about if I have a custom indicator, Will it work on that too. Please let me know.
What about if I have a custom indicator, Will it work on that too. Please let me know.
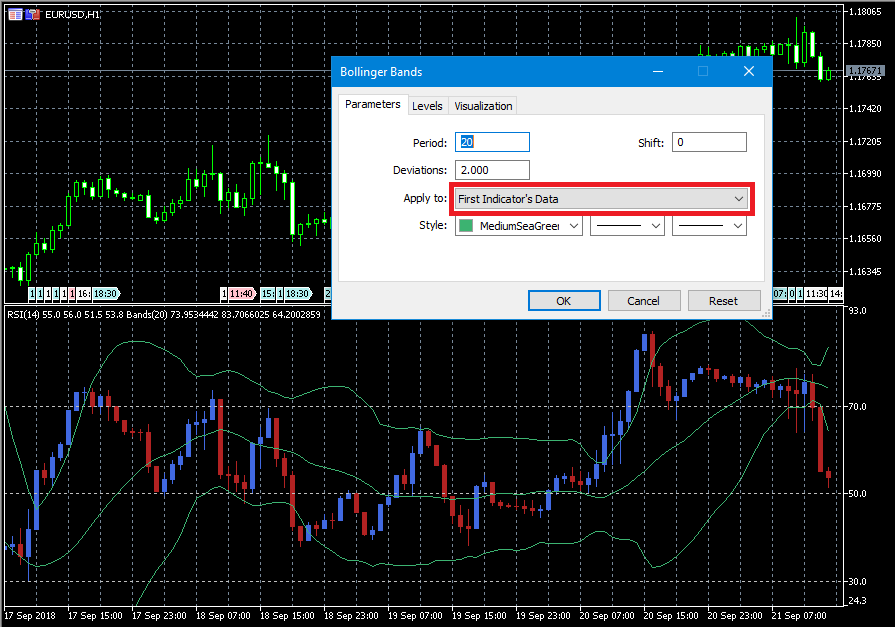
Yes, it only works on a custom indicator in that window. If there are two, switch between First Indicator's Data and Previous Indicator's Data.
Yes, it only works on a custom indicator in that window. If there are two, switch between First Indicator's Data and Previous Indicator's Data.
OK I will try it out and let you know.
- Free trading apps
- Over 8,000 signals for copying
- Economic news for exploring financial markets
You agree to website policy and terms of use
I have plotted the same real candles as it is from the chart 0 to indicator sub window.
The I drag and dropped the bollinger bands on both the windows. I found a hell lot of difference in the bands scale or placement inside the window. I do not understand how to get it right. Please help me.
Here is the image that will show you my attempt.:
Please let me know the way to even the scales.