You are missing trading opportunities:
- Free trading apps
- Over 8,000 signals for copying
- Economic news for exploring financial markets
Registration
Log in
You agree to website policy and terms of use
If you do not have an account, please register
Hence the example with price.
Hello,
I will do it without histogram, but with line.
Thank you very much for your help.
I have give up the candle ihstogram idea for better one (to me).
Nb : anyway, thank you very much for your help.
Always from this work https://www.mql5.com/go?link=https://www.mql5.com/ru/code/9780
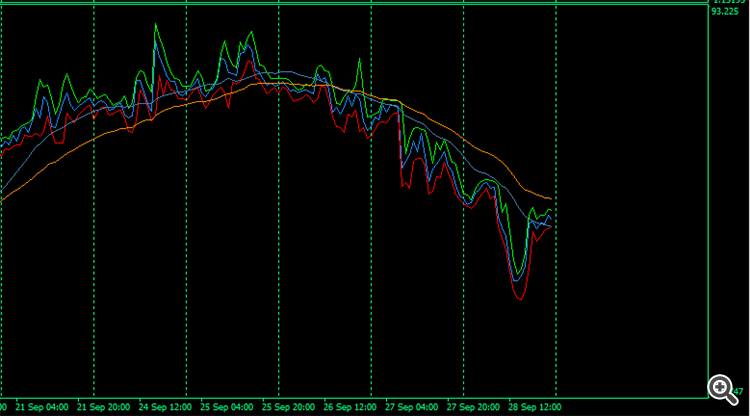
I have added the high and low lines like this.
And I obtain this result in the subwindow :

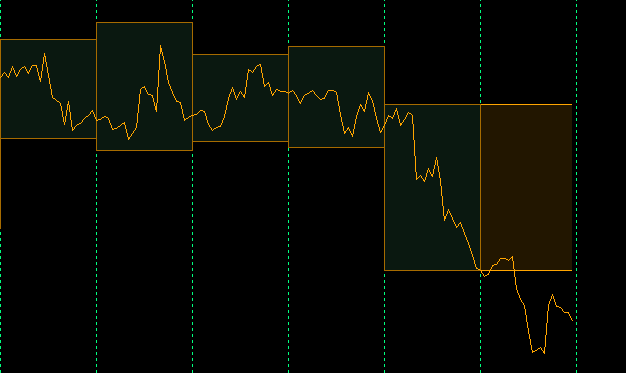
And now, the idea is to get the highs and lows of each day.
Like this code (but not for the price chart, but from and for the subwindow's values) :
To have this result (in subwindow)

At this point, my skills are limited, so I really need deep help with good lines of code very please.
Kind regards.
There is really no way to get the highs and lows for each day on the indicator in the subwindow (like we can do it with the cross price ) ?
So i will open another one with the focus of my new and last point.
Regards.
As i have no response, i think maybe i have gone too far away from the initial title of this thread.
So i will open another one with the focus of my new and last point.
Regards.
Here it is : https://www.mql5.com/en/forum/282065#comment_8908614