Hello did you,
//--- An array to store colors
color colors[]={clrRed,clrBlue,clrGreen};
//--- Set the color as the PLOT_LINE_COLOR property
   PlotIndexSetInteger(0,PLOT_LINE_COLOR,colors[color_index]);
Or see: https://www.mql5.com/en/docs/customind/indicators_examples/draw_histogram

- www.mql5.com
Hello did you,
Or see: https://www.mql5.com/en/docs/customind/indicators_examples/draw_histogram
In fact,
I have approached it the wrong side.
My final result is a body open close candle.
I will rethink the code.
I saw a work on it by WHRoeder in this forum.
Thank you.
If its a candle you can use DRAW_CANDLES or DRAW_COLOR_CANDLES with OHLC data and one extra buffer to set color.
But all this stuff doesn't work in mt4 ... Does it ?
If its a candle you can use DRAW_CANDLES or DRAW_COLOR_CANDLES with OHLC data and one extra buffer to set color.
Not working in mql4
https://docs.mql4.com/en/constants/indicatorconstants/drawstyles

- docs.mql4.com
#property strict
#property indicator_separate_window
#property indicator_buffers 3
#property indicator_plots   3
//--- plot Close
#property indicator_label1  "Close"
#property indicator_type1   DRAW_NONE
//--- plot Bull
#property indicator_label2  "Bull"
#property indicator_type2   DRAW_HISTOGRAM
#property indicator_color2  clrLimeGreen
#property indicator_style2  STYLE_SOLID
#property indicator_width2  2
//--- plot Bear
#property indicator_label3  "Bear"
#property indicator_type3   DRAW_HISTOGRAM
#property indicator_color3  clrFireBrick
#property indicator_style3  STYLE_SOLID
#property indicator_width3  2
//--- indicator buffers
double         CloseBuffer[];
double         BullBuffer[];
double         BearBuffer[];
//+------------------------------------------------------------------+
//| Custom indicator initialization function                         |
//+------------------------------------------------------------------+
int OnInit()
  {
//--- indicator buffers mapping
   SetIndexBuffer(0,CloseBuffer);
   SetIndexBuffer(1,BullBuffer);
   SetIndexBuffer(2,BearBuffer);
   SetIndexLabel(1,NULL);
   SetIndexLabel(2,NULL);
   SetIndexEmptyValue(0,0.0);
//---
   return(INIT_SUCCEEDED);
  }
//+------------------------------------------------------------------+
//| Custom indicator iteration function                              |
//+------------------------------------------------------------------+
int OnCalculate(const int rates_total,
                const int prev_calculated,
                const datetime &time[],
                const double &open[],
                const double &high[],
                const double &low[],
                const double &close[],
                const long &tick_volume[],
                const long &volume[],
                const int &spread[])
  {
//---
   int begin=!prev_calculated?rates_total-2:rates_total-prev_calculated;

   for(int i=begin;i>=0;i--)
     {
      CloseBuffer[i]=CloseBuffer[i+1]+close[i]-close[i+1];
      if(CloseBuffer[i]>=CloseBuffer[i+1])
        {
         BullBuffer[i]=CloseBuffer[i];
         BearBuffer[i]=0.0;
        }
      else
        {
         BullBuffer[i]=0.0;
         BearBuffer[i]=CloseBuffer[i];
        }
      }
//--- return value of prev_calculated for next call
   return(rates_total);
  }
//+------------------------------------------------------------------+
Not working in mql4
https://docs.mql4.com/en/constants/indicatorconstants/drawstyles
Ah ok my bad i didn't realize you was talking about MQL4.
We don't use that stuff anymore, it's obsolete so i would not know about how to solve the issue in that case.
Thank you....
But in this case, for the index purpose, it doesn't work, because when we put the value "0.0",
It will force the subwindow's minimum to "0.0", and the graphical result wil be a "crushed" horizon effect.
Thank you....
But in this case, for the index purpose, it doesn't work, because when we put the value "0.0",
It will force the subwindow's minimum to "0.0", and the graphical result wil be a "crushed" horizon effect.
Hence the example with price.

Hence the example with price.
Ok, i will look at this this week.
Thank you.
- Free trading apps
- Over 8,000 signals for copying
- Economic news for exploring financial markets
You agree to website policy and terms of use
Hello every one,
I am working on a indicator based on this one :
https://www.mql5.com/ru/code/9780
I am modifying it in histogram version by changing :
"DRAW_LINE" with "DRAW_HISTOGRAM" .
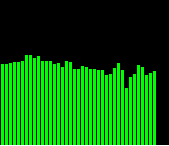
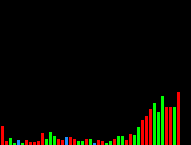
My problem is that my code, drawing all histogram bars in one color dependig on the current candle's color (bullish or bearish)
With images,
I have that


when I want this
So far, here is my code :
Please help.
Regards.