Indicators: Kagi Charts
Forum on trading, automated trading systems and testing trading strategies
How to Start with Metatrader 5
newdigital, 2014.03.28 19:22
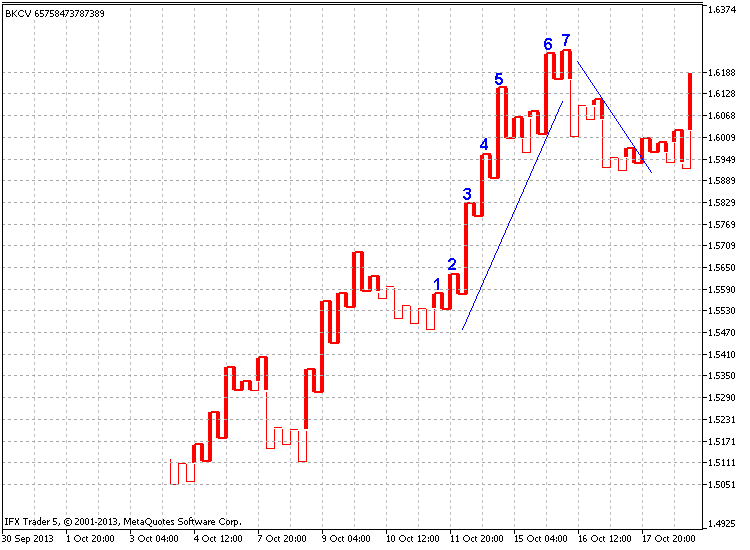
The article "Indicator for Point and Figure Charting" has described one of the programming ways of creating Point and figure chart. This chart is known since the 19th century. However, this is not the only chart from the remote past. Another notable representative of the early types of the financial market representation is Kagi chart. This chart will be discussed in the present article.
The stock exchange – financial institution unfamiliar to the 19th-century Japan – has been established in May 1878. It is known as Tokyo Stock Exchange nowadays. This event played a vital role in creating and subsequent development of Kagi charts. Europe and USA came to know Kagi charts after the publication of Steve Nison's "Beyond Candlesticks: New Japanese Charting Techniques Revealed" in 1994.
The Japanese words "Kagi" means an L-shaped key that was in use at the time of the chart development. Also, there is a modified version of the name – "key chart". In Steve Nison's "Beyond Candlesticks", you can also find alternative names of the chart: price range chart, hook chart, delta or chain chart.
What is so special about this chart? Its main feature is that it ignores the time scale leaving only the price one (unlike Japanese candlesticks, bars and lines). Thus, the chart hides inconsiderable price fluctuations leaving only the most significant ones.
The chart represents a set of thick Yang and thin Yin lines replacing each other depending on the market situation. In case the market moves in the same direction, the line is extended reaching a new price range. However, if the market turns back and reaches a predefined amount, the Kagi line is drawn in the opposite direction in the new column. The predefined amount is set either in points (usually used for currency pairs), or in percentage value of the current price (usually used for stocks). The line thickness varies depending on the closest High or Low breakthrough.
- Free trading apps
- Over 8,000 signals for copying
- Economic news for exploring financial markets
You agree to website policy and terms of use
Kagi Charts:
Author: Collector