Discussion of article "ZUP - Universal ZigZag with Pesavento patterns. Search for patterns"
Eugene, thank you for your labour.
Everything about the parameters of patterns is very clear. It was a bit difficult to find this very article, but I found your message on https://www.forexdengi.com/threads/80951-analiz-zup-osnovnie-valyutnie-pari-i-zoloto?p=18036431&viewfull=1#post18036431.
I, as I think, and many other traders, who are just starting to get acquainted with your indicator, are very interested in what zigzag algorithm is the most optimal for work. Or so - could you describe the pros/cons of each available algorithm, as I am sure that they were all added to the indicator for a reason. I realise that in some cases it is preferable to use one zigzag and in other cases another.
Maybe you could give some recommendations? Perhaps there is some more universal algorithm and its basic settings (where everyone could start), which would be suitable for a start, so that you do not have to painfully and repeatedly "dig" through the parameters, changing them and examining the chart in search of changes in the work of the indicator with the next set of settings?
PS Yes, I mean exclusively working with the indicator in the pattern search mode (ExtIndicator = 11).
Thanks.
- 2018.03.02
- nen
- www.forexdengi.com
And a few more questions:
1. Is there an option in the indicator that displays alphabetic designations of pattern tops in the colour of the pattern (or even better directly with the name on the chart)? It seems to me that it would be more convenient to orientate on the formed or forming pattern.
2. What is the difference between patterns with the same name without prefix and with prefixes "A" and "max", for example - "Gartley", "A Gartley" and "max Gartley"?
3. What is the group of patterns "TOTAL" - are they user patterns?
4. If you use the"ExtGartleyTypeSearch - pattern search mode" parameter in the "Chinese Toy 1" mode, then the patterns - _http://prntscr.com/inkjnc are present on the last zigzags, and if you switch to the "0 - search ends after the first found pattern" mode, then the patterns that were in the Chinese Toy mode will not be present - _http://prntscr.com/inkkfx. Most likely there will be 1-2 patterns that have long since ended. Question, why the search mode of the first found pattern does not show the closest pattern to the current bar?
Well, how to connect this indicator to an Expert Advisor, so that it would spit out its patterns to it, and the latter would make trading decisions?
I was interested in the topic of patterns 10 years ago. And about the same time on the ONICS forum there were discussed variants of transferring parameters of patterns into Expert Advisors and for external use.
I didn't go into this topic - output of pattern parameters for use in Expert Advisors - much. But I have made several options for outputting information about patterns.
1) Information about patterns can be output to external csv files using the writeInfoPatternsToFileCSV parameter or to XML format using thewriteInfoPatternsToFileXML parameter .
2) You can output pattern information to a global variable
ExtGlobalVariableSet - allows writing pattern information to global variables of the terminal
---------
At present I don't see much prospects of using patterns for myself. Because I use other ZUP tools. They are enough for me. First of all, they are Andrews Pitchfork. Then Fibo levels and some others.
But sometimes, when I clearly see a formed pattern, I check it with the help of ZUP.
I don't use EAs. Only manual trading.
I was interested in the topic of patterns 10 years ago. And about the same time on the ONICS forum there were discussed variants of transferring parameters of patterns into Expert Advisors and for external use.
I did not go into this topic. But I made several variants of outputting information about patterns.
Thank you for your informative reply!
ys_mql5:
I, as I think, and many other traders, who are just starting to get acquainted with your indicator, are very interested in which zigzag algorithm is the most optimal for work. Or so - could you describe the pros/cons of each available algorithm, as I am sure that they were all added to the indicator for a reason. I realise that in some cases it is preferable to use one zigzag and in other cases another.
Maybe you could give some recommendations? Perhaps there is some more universal algorithm and its basic settings (where everyone could start), which would be suitable for a start, so that you do not have to painfully and repeatedly "dig" through the parameters, changing them and examining the chart in search of changes in the work of the indicator with the next set of settings?
PS Yes, I mean exclusively working with the indicator in the pattern search mode (ExtIndicator = 11).
Thanks.
1. Is there an option in the indicator, which displays alphabetic designations of pattern tops in the colour of the pattern (or even better directly with the name on the chart)? It seems to me that it would be more convenient to orientate on the formed or forming pattern.
2. What is the difference between patterns with the same name without prefix and with prefixes "A" and "max", for example - "Gartley", "A Gartley" and "max Gartley"?
3. What is the group of patterns "TOTAL" - are they user patterns?
4. If you use the"ExtGartleyTypeSearch - pattern search mode" parameter in the "Chinese Toy 1" mode, then the patterns - _http://prntscr.com/inkjnc are present on the last zigzags, and if you switch to the "0 - search ends after the first found pattern" mode, then the patterns that were in the Chinese Toy mode will not be present - _http://prntscr.com/inkkfx. Most likely there will be 1-2 patterns that have long since ended. Question, why in the mode of searching for the first found pattern the closest pattern to the current bar is not displayed?
In the ExtIndicator = 11 mode, the standard zigzag algorithm is used. What are patterns. The XA ray is an impulse wave. And the ABCD structure is a corrective wave. That is, in theory, patterns are part of the Elliott wave structure. More than 10 years ago Putnik researched the parameters of the standard zigzag and suggested parameter settings that do not always but often enough reveal Elliott wave patterns. Putnik specialises in wave analysis. These are his default settings. In fact, there can be many variants of settings. Talk to Putnik on this topic. He specialises in patterns.
I, as I wrote above, more often use Andrews Forks. If you tie them to the tops of the waves, the pitchforks magically tell you where the market reversal will occur long before the market gets there.
Here's a current example on the Yen:
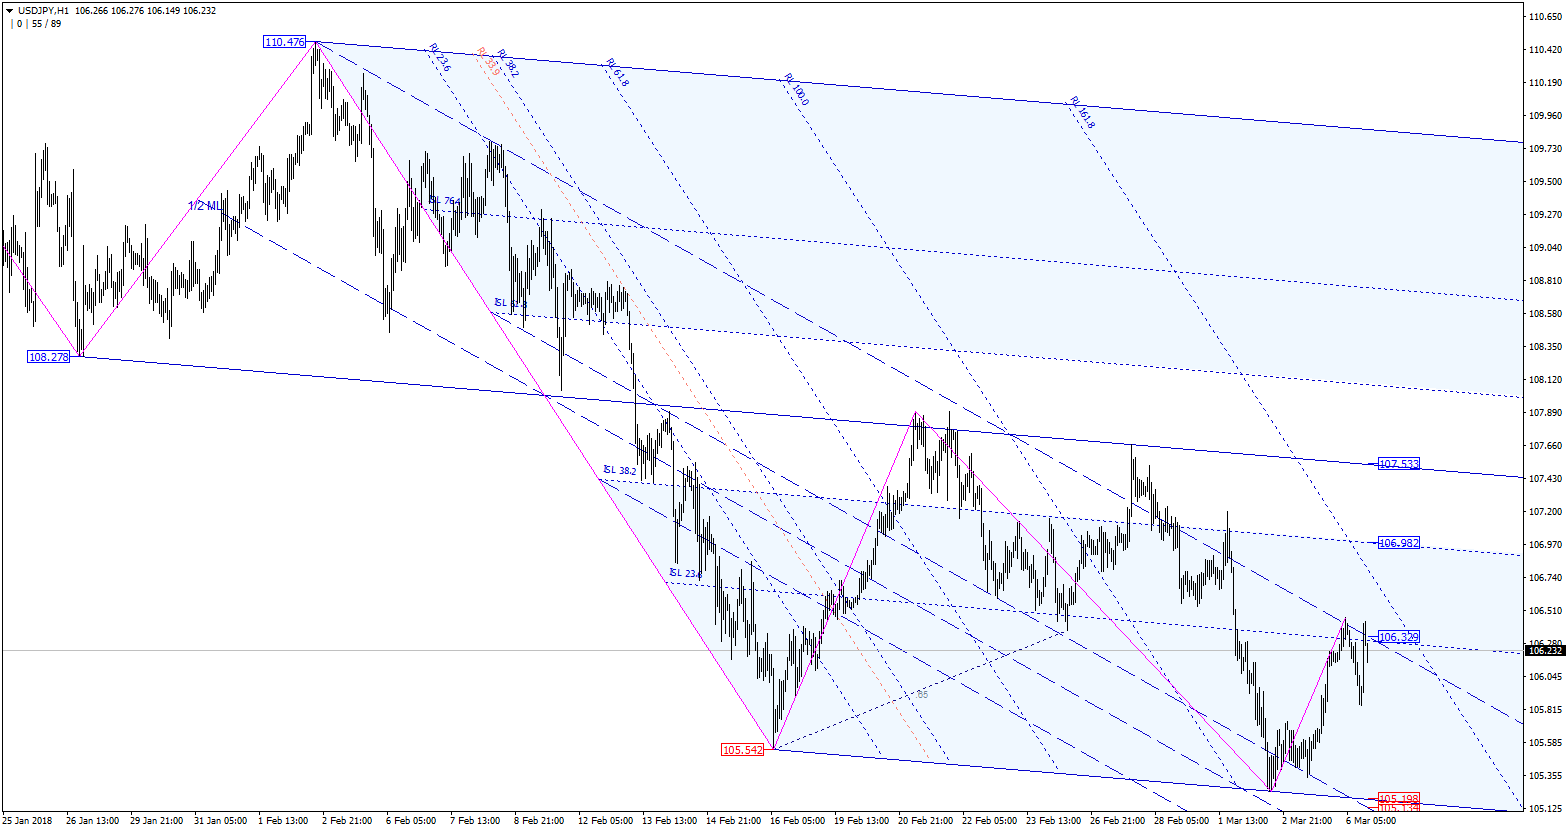
Look at how accurately the market bounces off the lines presented in the Andrews pitchfork set. I can't imagine that this is possible with patterns.
It's just some kind of miracle. I have an explanation for why this happens. But let's leave that topic.
Re.
1) There is no way to output letter designations of pattern vertices (XABCD).
2 and 3) The letter "A" stands for antipatterns. Look at A Gartley and Gartley for example. These as patterns and TOTAL were invented by the lieutenant. The prefix max is used for patterns that were in the first versions of ZUP, which is where the pattern search was created. These patterns used the widest range of retracements. The current version has built in, shall we say, classic Gartley and max Gartley. They differ in parameters. The differences are small.
4) For the Chinese toy mode the values of ExtGartleyTypeSearch parameter 1 or 2 are used. In one case a one-time search for patterns is performed. In the other case, the patterns are searched at each change of the zero bar. In the limit, the search is performed on each tick, when the zero bar changes its size on each tick. This is too expensive for a metatrader.
The ExtIndicator = 11 mode uses the standard zigzag algorithm. What are patterns. The XA ray is an impulse wave. And the ABCD structure is a correction wave. That is, in theory, patterns are part of the Elliott wave structure. More than 10 years ago Putnik researched the parameters of the standard zigzag and suggested parameter settings that do not always but often enough reveal Elliott wave patterns. Putnik specialises in wave analysis. These are his default settings. In fact, there can be many variants of settings. Talk to Putnik on this topic. He specialises in patterns.
I, as I wrote above, more often apply Andrews Forks. If they are tied to the tops of waves, the pitchforks magically suggest the places where the market reversal will occur long before the market gets there.
Here is a current example on the Yen:
Look at how accurately the market bounces off the lines presented in the Andrews pitchfork set. I don't imagine this is possible with patterns.
It's just some kind of miracle. I have an explanation for why this happens. But let's leave that topic.
For questions.
1) There is no possibility to output alphabetic designations of pattern vertices (XABCD).
2 and 3) The letter "A" stands for antipatterns. Look at A Gartley and Gartley for example. These as patterns and TOTAL were invented by the lieutenant. The prefix max is used for patterns that were in the first versions of ZUP, which is where the pattern search was created. These patterns used the widest range of retracements. The current version has built in, shall we say, classic Gartley and max Gartley. They differ in parameters. The differences are small.
4) For the Chinese toy mode the values of ExtGartleyTypeSearch parameter 1 or 2 are used. In one case a one-time search for patterns is performed. In the other case, the patterns are searched at each change of the zero bar. In the limit, the search is performed on each tick, when the zero bar changes its size on each tick. This is too expensive for a metatrader.
Eugene, thank you for your comment.
Do you build the pitchfork manually or do you use automatic indicator building? And if so, the pitchfork algorithm uses the extrema found by the zigzag. And still we come to the point that we need to understand which zigzag was implemented for what purpose. Can you give a recommendation, which zigzag is more optimal to start with, maybe there is some special one for better work of the pitchfork algorithm?
Eugene, thank you for your comment.
Do you build pitchforks manually or do you use automatic indicator building? And if so, the pitchfork algorithm uses the extrema found by the zigzag. And still we come to the point that we need to understand which zigzag was implemented for what purpose. Can you give a recommendation, which zigzag is the best to start with, maybe there is some special one for better work of the pitchfork building algorithm?
The standard zigzag ExtIndicator=0 is used. Default.
You can do manual wave markup with the wave zigzag. Description in the article about version 151.
Pitchforks are bound either to the extrema of the standard zigzag or to the wave zigzag.
It takes some skill. You can do it the easy way. Switch on the static pitchfork. Pstroeniya will be carried out on automatic. On the forexdengi forum, that's what everyone does. They build pitchforks on automatic.
But these pitchforks are not always useful. Understanding comes with time. It is useful to study wave analysis. For starters, you can at least watch webinars from Roman Pavelko. His webinars are broadcasted periodically by FxPro. Search on YouTube.
You can also look for Putnika's webinars on YouTube. Type DML@EWA in the search. There is a lot of information on the application of the Andrews Fork from ZUP there
The default zigzag ExtIndicator=0 is used. Default.
It is possible to make manual wave markup with wave zigzag. Description in the article about version 151.
Pitchforks are bound either to the extrema of the standard zigzag or to the wave zigzag.
It takes some skill. You can do it the easy way. Switch on the static pitchfork. Pstroeniya will be carried out on automatic. That's what everyone on the forexdengi forum does. They build pitchforks on automatic.
But these pitchforks are not always useful. Understanding comes with time. It is useful to study wave analysis. For a start, you can at least watch webinars by Roman Pavelko. His webinars are broadcasted periodically by FxPro. Look for them on YouTube.
You can also look for Putnika's webinars on YouTube. Type DML@EWA in the search. There is a lot of information there on the application of the Andrews Fork from ZUP
Great, thanks. This will be a good starting point to learn this analysis technique.
I have looked at the market analysis by Gelox on forexdengi site, of course, you can't understand it at once (even if you understand the principles of wave analysis in general), you need to start small - with studying the basics of this approach. Besides, as I understand, there are no specific training materials on DML&EWA, as Putnik, as far as I understand, holds (or has held?) paid seminars on this topic. So, if there is information in the public domain, it is scattered in bits and pieces or only in practical application when analysing the market.
Eugene, could you recommend some good literature and/or resources on the topic of market analysis with the help of Andrews Pitchfork? I found Patrick Mikula's book "Alan Andrews' Best Trend Line Methods Plus Five New Techniques" in my stash. I think you can get a basic understanding of working with VE from there.
One more thing - what configuration for working with ZUP in MT4 is the most relevant now:
- 9 ZUPs with different display settings on different TFs (as Igor advises in his seminar from 2013).
- Gelox's "ZigZag Kit" posted by you - https://www.forexdengi.com/threads/10201-zup-i-vili-endryusa-termini-ponyatiya-parametri?p=12419002& viewfull=1#post12419002
- Or, judging by Gelox's most relevant post from 03.03.2018 - setting up 2 ZUP sets in 3 windows with different TFs and different minBars and ExtBackstep settings - https://www.forexdengi.com/threads/84088-nastroyka-vil-endryusa-v-indikatornoy-platforme-zupv150-s-nen-v-kartinkah-ot-sledopyt?p=18037607& viewfull=1#post18037607
- Free trading apps
- Over 8,000 signals for copying
- Economic news for exploring financial markets
You agree to website policy and terms of use
New article ZUP - Universal ZigZag with Pesavento patterns. Search for patterns has been published:
The ZUP indicator platform allows searching for multiple known patterns, parameters for which have already been set. These parameters can be edited to suit your requirements. You can also create new patterns using the ZUP graphical interfaces and save their parameters to a file. After that you can quickly check, whether these new patterns can be found on charts.
The ExtPanel parameter at the end of parameters list of the indicator platform is provided for working with the ZUP graphical interface. By setting ExtPanel=true you enable working with the graphical interface.
If you set ExtPanel=true, but the graphical interface does not show up or it has been removed by pressing ESC, the combination of SHIFT-Z will display it.
Then press Insert. In the next menu, click on the "butterfly icon" — . This opens a menu for working with patterns:
Compared to version 151, this one contains the Select button. A click on the button opens the following menu with a list:
The menu allows connecting patterns from the list to search or disconnecting them without using the indicator's parameters panel. This can be done by simply clicking on the appropriate button. The values of parameters of patterns to connect will be set in the list of ZUP parameters.
Author: Eugeni Neumoin