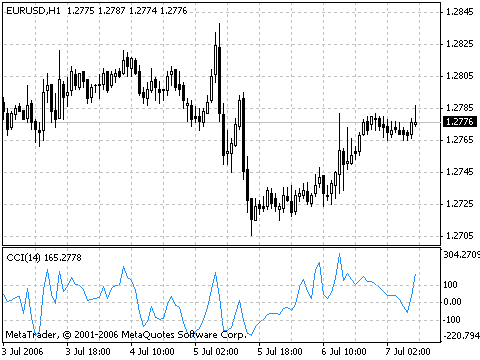
Is it possible to make it display like the CCI in this site http://stockcharts.com/school/doku.php?id=chart_school:technical_indicators:commodity_channel_index_cci whereby if it is above +100 or below -100 there is solid
Is is possible to get the CCI and ATR that displays the information in a histogram vs. a line? Thanks for the information.
best
pelicanz
Hi, Im new in this, can any one help me, can i create a EA with signals from the CCI, like +100 go short -100 buy ?
thanks
Is is possible to get the CCI and ATR that displays the information in a histogram vs. a line? Thanks for the information.
best
pelicanz
I have replaced Typical Price (=H+L+C/3) with Close Price, but the result is not the same as the result i see in MT4, but with Typical Price i have the same value.
The formula:
CCI = (Typical Price - SMA(Typical Price, Period) ) / ( 0.015* Mean Deviation ( SMA(Typical Price, Period) - Typical Price))
is correct for Typical Price, but not for Close Price. use MT other formula when calculate with close Price?
- Free trading apps
- Over 8,000 signals for copying
- Economic news for exploring financial markets
You agree to website policy and terms of use
Commodity Channel Index, CCI:
Commodity Channel Index (CCI) indicator measures the deviation of the commodity price from its average statistical price.
High values of the index point out that the price is unusually high being compared with the average one, and low values show that the price is too low.
In spite of its name, the Commodity Channel Index can be applied for any financial instrument, and not only for the commodities.

/div>Author: MetaQuotes Software Corp.