Join our fan page
- Views:
- 37896
- Rating:
- Published:
- 2005.11.29 11:53
- Updated:
- 2016.11.22 07:32
-
Need a robot or indicator based on this code? Order it on Freelance Go to Freelance
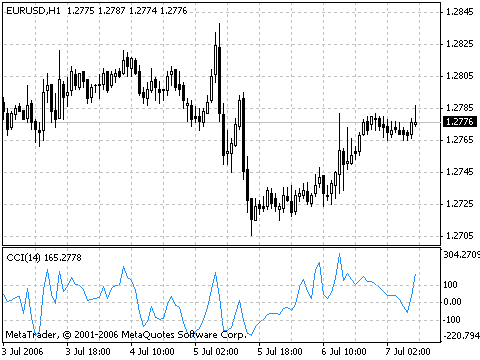
Commodity Channel Index (CCI) indicator measures the deviation of the commodity price from its average statistical price.
High values of the index point out that the price is unusually high being compared with the average one, and low values show that the price is too low.
In spite of its name, the Commodity Channel Index can be applied for any financial instrument, and not only for the commodities.

There are two basic techniques of using Commodity Channel Index:
- Finding the divergences
The divergence appears when the price reaches a new maximum, and Commodity Channel Index can not grow above the previous maximums. This classical divergence is normally followed by the price correction. - As an indicator of overbuying/overselling
Commodity Channel Index usually varies in the range of ±100. Values above +100 inform about overbuying state (and about a probability of correcting decay), and the values below 100 inform about the overselling state (and about a probability of correcting increase).
Calculation:
To find a Typical Price. You need to add the HIGH, the LOW, and the CLOSE prices of each bar and then divide the result by 3.
TP = (HIGH + LOW +CLOSE)/3To calculate the n-period Simple Moving Average of typical prices.
SMA(TP, N) = SUM[TP, N]/NTo subtract the received SMA(TP, N) from Typical Prices.
D = TP — SMA(TP, N)To calculate the n-period Simple Moving Average of absolute D values.
SMA(D, N) = SUM[D, N]/NTo multiply the received SMA(D, N) by 0,015.
M = SMA(D, N) * 0,015To divide M by D
CCI = M/D
where:
- SMA — Simple Moving Average;
- N — number of periods, used for calculation.
Technical Indicator Description
Full description of CCI is available in the Technical analysis: Commodity Channel Index
Translated from Russian by MetaQuotes Ltd.
Original code: https://www.mql5.com/ru/code/7769
 Bulls Power
Bulls power oscillator (Bulls Power, Bulls) - trend following indicator.
 Bears Power
Bears power oscillator (Bears Power, Bears) - trend following indicator.
 Heiken Ashi
Heiken Ashi - Custom Indicator as Candlesticks Example.
 Ichimoku Kinko Hyo
Ichimoku Kinko Hyo indicator is predefined to characterize the market trend, Support and Resistance Levels, and to generate signals of buying and selling.