Indicators: Hurst Exponent
Unfortunately this indicator is very slow to run large backtests. I put it in my EA and I ran a backtest setted range to 3 years and timeframe to 1 minute, the result was an incredible increase from 3 seconds to 6 minutes time running. 120 times slower!! 😯
The version posted at this entry is "by the book" algorithm version
Use this version : Hurst exponent - optimized version instead
________________________
PS: What time frame and test settings did you use with 3 years data to get the result in 3 seconds? That is (in every tick mode back test) highly unlikely, but I would like to know. Or you were using open prices only mode?
In any case, the new version is faster ...

Otherwise, it is not possible to get results in 3 seconds with everytick in any system unless it has an extremely powerful system!
The version posted at this entry is "by the book" algorithm version
Use this version : Hurst exponent - optimized version instead
________________________
PS: What time frame and test settings did you use with 3 years data to get the result in 3 seconds? That is (in every tick mode back test) highly unlikely, but I would like to know. Or you were using open prices only mode?
In any case, the new version is faster ...
Very thanks for this improvement, I will try the new version.
----
About my backtest, I uploaded an image to show you how do I setted.
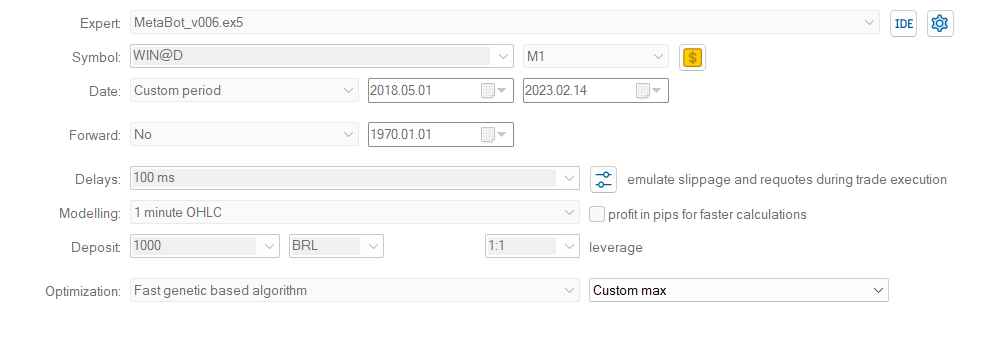
Hello.
Mr Andrew Lo (1991) advocated adjusting the standard deviation for the expected increase in range from short-range autocorrelation in the time series. This is the square root of
Š² = S² + 2Σ(j=1...q)[1-j/(q+1)]×C(j)
where q is some maximum lag over which short-range autocorrelation might be substantial and C(j) is the sample autocovariance at lag j. Using this adjusted rescaled range, he concludes that stock market return time series show no evidence of long-range memory.
- Free trading apps
- Over 8,000 signals for copying
- Economic news for exploring financial markets
You agree to website policy and terms of use
Hurst Exponent:
The Hurst Exponent is used as a measure of long-term memory of time series. It relates to the autocorrelations of the time series, and the rate at which these decrease as the lag between pairs of values increases. Studies involving the Hurst exponent were originally developed in hydrology for the practical matter of determining optimum dam sizing for the Nile river's volatile rain and drought conditions that had been observed over a long period of time. The name "Hurst exponent", or "Hurst coefficient", derives from Harold Edwin Hurst (1880 - 1978), who was the lead researcher in these studies; the use of the standard notation H for the coefficient relates to his name also.
The Hurst exponent is referred to as the "index of dependence" or "index of long-range dependence". It quantifies the relative tendency of a time series either to regress strongly to the mean or to cluster in a direction.
Author: Mladen Rakic