Indicators: QQE [v02] and QQE multi-timeframe [v02]
Quantitative Qualitative Estimation (QQE)
The QQE indicator consists of a smoothed Relative Strength Index
(RSI) indicator and two volatility-based trailing levels (fast and
slow). The Fast Trailing Level (TL) and Slow TL are constructed by
calculating the ATR of the smoothed RSI over n-periods and then further
smoothing the ATR using an additional n-periods Wilders smoothing
function. This smoothed ATR of RSI is then multiplied by the Fast and
Slow ATR Multipliers to calculate the final Fast and Slow Trailing
Levels.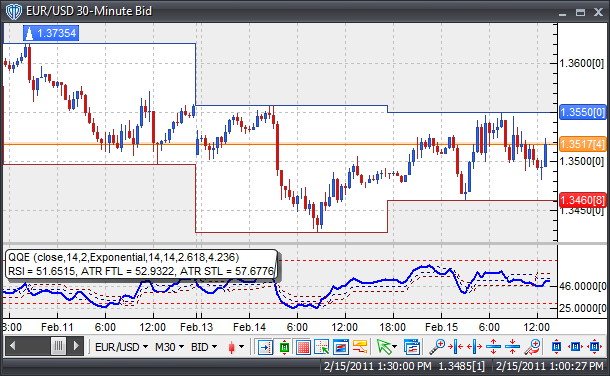
Interpretation
There are several different methods in which the QQE can be used to generate trading signals. Here are few of the more common techniques:
Crossovers:
- RSI / Fast ATR TL or Slow ATR TL Crossover: A buy
signal occurs when the RSI crosses above the Fast ATR TL or Slow ATR TL
and a sell signal occurs when RSI crosses below the Fast ATR TL or Slow
ATR TL.
- RSI / 50-level Crossover: When the RSI crosses above 50 a buy
signal is given. Alternatively, when the RSI crosses below 50 a sell
signal is given.
- Fast ATR TL / Slow ATR TL Crossover: A buy signal occurs when the Fast ATR TL crosses above the Slow ATR TL and a sell signal occurs when Fast ATR TL crosses below the Slow ATR TL.
Divergence: Looking for divergences between the QQE indicator and price can prove to be very effective in identifying potential reversal points in price movement. Trade long on Classic Bullish Divergence: Lower lows in price and higher lows in the QQE; Trade short on Classic Bearish Divergence: Higher highs in price and lower highs in the QQE.
Overbought/Oversold Conditions: Much like the original RSI (and other oscillators), the QQE indicator can be used to identify potential overbought and oversold conditions in price movements. An Overbought condition is generally described as the QQE being greater than or equal to the 70% level while an oversold condition is generally described as the QQE being less than or equal to the 30% level. Trades can be generated when any of the QQE outputs (RSI, Fast ATR TL or Slow ATR TL) crosses these levels. When the RSI, Fast ATR TL or Slow ATR TL crosses above 30 a buy signal is given. Alternatively, when the RSI, Fast ATR TL or Slow ATR TL crosses below 70 a sell signal is given.
- Free trading apps
- Over 8,000 signals for copying
- Economic news for exploring financial markets
You agree to website policy and terms of use
QQE [v02] and QQE multi-timeframe [v02]:
QQE - Qualitative Quantitative Estimation, calculated as two indicators:
Trade signals:
The QQE MTF indicator can be applied to any timeframe, higher or lower than the current chart's timeframe.
Compared to the original single-timeframe QQE indicator, the only extra setting is the second timeframe used as input for the calculations.
Author: traderak20