April 15 - May 10, USDJPY Holygrail?
See BoJ intervention-free cycle from 2001 to 1996. They're perfect for trading to make money!

Ok so maybe stochastic can be used to find out if it's overpriced or underpriced? I'm too tired right now but I'll check into it soon
Great observation! Can you also give indicator to dicide what entry should we take, maybe stochastic or even the news?
Bump! just want to bring your attention, as April 2007 is just a few months away.
2006 was a predictable year. Now I think i've got 2007 in control. USDJPY is going to hit as low as 109 in May 2007. That could be 1000 pips gross profit if I short USDJPY now.
You see, December and Jan are when JPY is weakest (and USDJPY goes highest). Now we are right on the mountain peak. After Jan, JPY will grow strong, so USDJPY is going to hit the bottom.
Do you think now we have "very good" short opportunity?
If USDJPY dips below 117.50, will you go short taking 300 pips profit at 114.50?
hei, you;re in right about usdjpy!
but now it's not april but last february until middle march april.
one half month earlier than you found.
maybe one month earlier again next year?
it;s psychological aspect is strong. even global stock index have influenced by this cycle.
maybe the right strategy is wait for big candle tren or strong tren that bigger than before.
and follow it. waiting for retrace and close it.
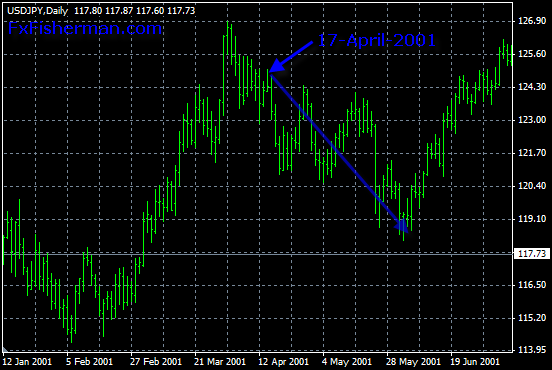
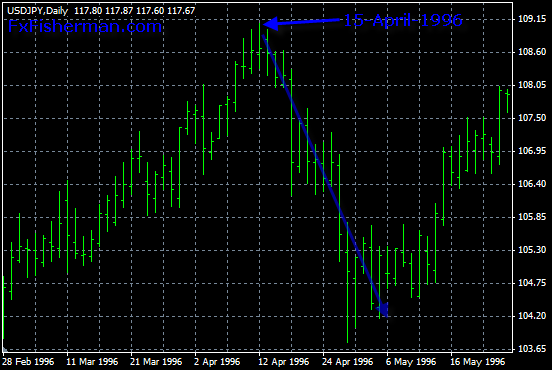
USDJPY has moved down more than 200 pips from April 15 for two days. It is really easy to predict.
I'm checking the USD composite indicator i coded. The evidence shows that it's not the yen but the dollar itself losses value. Cable (gbpusd), loonie (usdcad), kiwi (nzd), swissie (usdchf) and fiber (eurusd) all moved from April 15. Hence, this cycle must have something to do with USD.
I've done a bit of research on this one. It may somehow related to 'US Tax Returns' and book closing. Ok, around the April 15 the end of fiscal year is the death line of paying the taxes. My hypothesis is that the end of paying taxes = fall in dollar value.
Do tax payers have anything to do with selling treasure bills or lowering interest rates?
If we can figure out how to read the cycle before hand, we will be all millionaires. How do we use technical analysis to trade this?
- Free trading apps
- Over 8,000 signals for copying
- Economic news for exploring financial markets
You agree to website policy and terms of use
Hello everyone
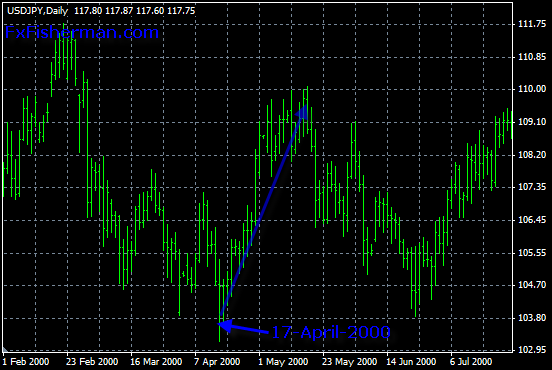
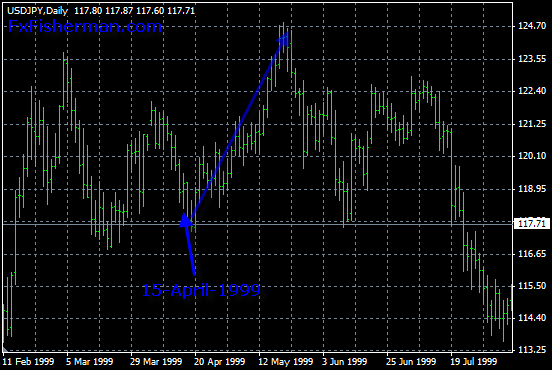
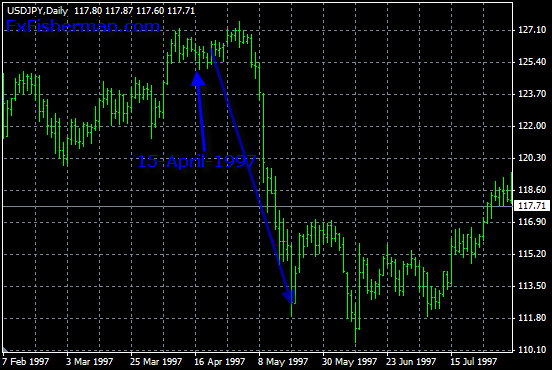
Let's discuss this interesting cycle of USDJPY from April 15 to May 10. Seeing the charts from 2006 to 2002, I believe we can make a nice system out of this one.
Warning: We could be millionaires if we figure it out the best strategy to trade this cycle!
Discussion questions: