Discussion of article "Graphical Interfaces X: Sorting, rebuilding the table and controls in the cells (build 11)"
The article is interesting.
1. This is an example. Clicking a button in the example replaces the triggering of a condition in the programme. Although you can also add buttons in the programme - there is not much that your imagination can do.
2. I understand - having more than two On/Off positions. For example Above/Below/Middle
1. this is an example. Pressing the button in the example replaces the triggering of some condition in the programme. Although you can also add buttons in the programme - there is not much that your imagination can do.
2. I understand - having more than two On/Off positions. For example, Above/Below/Middle.
1. Thank you, partially understood. The necessity of adding rows with the arrival of new data is clear, but why programmatically or manually add columns after the actual construction of the table?
1. For example: a condition is triggered, when it is necessary to output an additional value to all rows of the table, which was zero before - a column is added, and the value is output to it. As soon as the condition disappears (with the onset of a new day, for example), the empty column can be removed until the next triggering of the condition.
2. And the indicator with three lines - is it from the area of multidimensional space? We make a switch in the zero column of the table with three positions - the upper indicator line, the middle indicator line and the lower indicator line, and in the subsequent cells of the row we enter the values of the selected indicator line.
Doesn't your imagination allow you to think of examples of what this will be useful for?
1. For example: a condition is triggered, when it is necessary to output an additional value to all rows of the table, which was zero before - a column is added and the value is output to it. As soon as the condition disappears (with the onset of a new day, for example), the empty column can be removed until the next triggering of the condition.
2. And the indicator with three lines - is it from the area of multidimensional space? We make a switch in the zero column of the table with three positions - the upper indicator line, the middle indicator line and the lower indicator line, and in the subsequent cells of the row we enter the values of the selected indicator line.
Doesn't your imagination allow you to think of examples of what this will be useful for?
1. It is possible to find a use for these features. It's just that the article doesn't explain why these features were added. That's why I asked.
1. Do you need to remind-explain why the head (mind) is given to man?
2. Have you ever seen a three-position switch in your life? In a car, for example. There's one on the ceiling (On/Off/Door).
1. Shall I remind you to explain why the head (mind) is given to man?
2. Have you ever seen a three-position switch in your life? In a car, for example. There's one on the ceiling.
Actually, I was hoping to get an answer from the author.
That's why it's flexible, it's not only the author who can think of what to use the elements of his library for. If Anatoly had made it so that the elements could be used only within a narrow, defined framework (well... like your creation on the video), what would be the interest in it?
Actually, I was hoping to get a response from the author.
In my opinion, Artem has given quite detailed examples.
If more clearly and within the framework of some already existing graphical interfaces, you can look at these options:
1. In Windows, open the "Windows Components" window. There you can see checkboxes with more than two states:
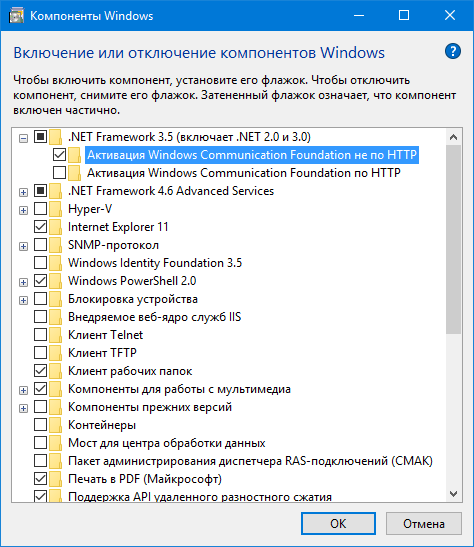
//---
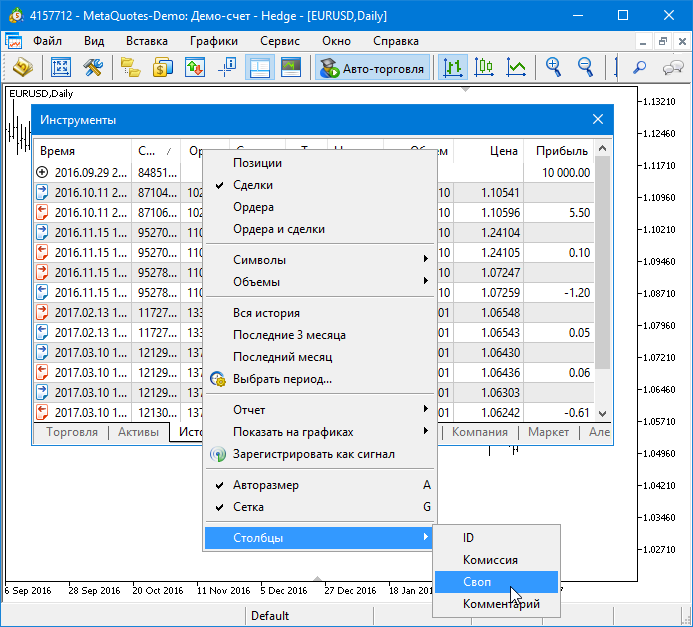
2. In the MetaTrader 5 terminal, open the "Tools" window. In the "History" tab you have the opportunity to switch on/off the visibility of some columns of the table in the context menu:
- Free trading apps
- Over 8,000 signals for copying
- Economic news for exploring financial markets
You agree to website policy and terms of use
New article Graphical Interfaces X: Sorting, rebuilding the table and controls in the cells (build 11) has been published:
We continue to add new features to the rendered table: data sorting, managing the number of columns and rows, setting the table cell types to place controls into them.
In the end, everything works like this:
Fig. 3. Demonstration of interaction with controls in the table cells.
Author: Anatoli Kazharski